SBI · 2023–2025
SBI: Turning Expert Services Into a Product
SBI delivered growth strategy through analysts who gathered data, interpreted it, and handed clients a plan. As the sole product designer, I moved that method into a self-service platform: three self-service workflows, one connected growth roadmap, and AI-assisted reporting that kept evidence and expert judgment visible.
Service
SBI sold growth expertise to enterprise sales and revenue teams. Analysts pulled information from CRM, finance, HR, and assessment systems, synthesized it, and delivered recommendations.
The service created value, but delivery depended on analyst capacity. Every engagement meant manual aggregation, interpretation, and presentation. The customer received an output, while the method stayed inside the consulting team.
SBI wanted to move toward software and subscription revenue. The product had to carry enough of the method that customers could use it directly, while preserving the judgment that made the work credible.
The opportunity was to automate the assembly, preserve the judgment, and make the plan useful after delivery.
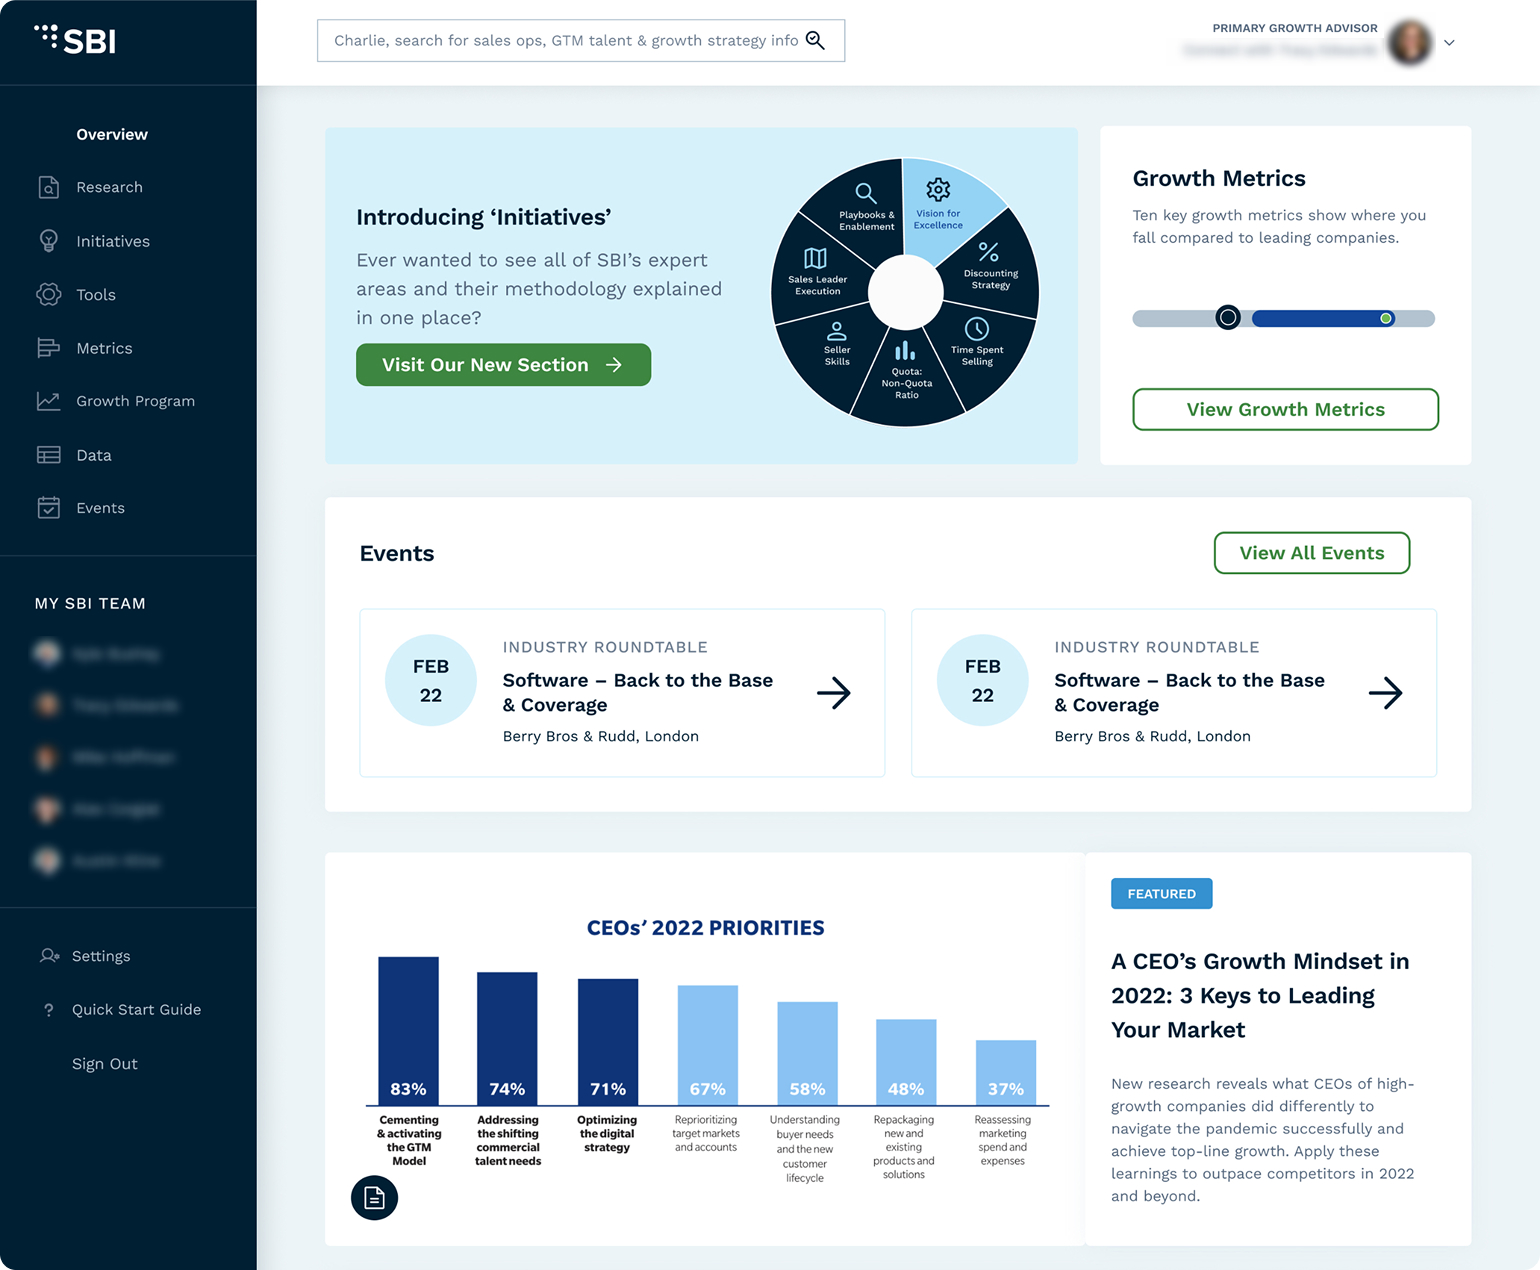
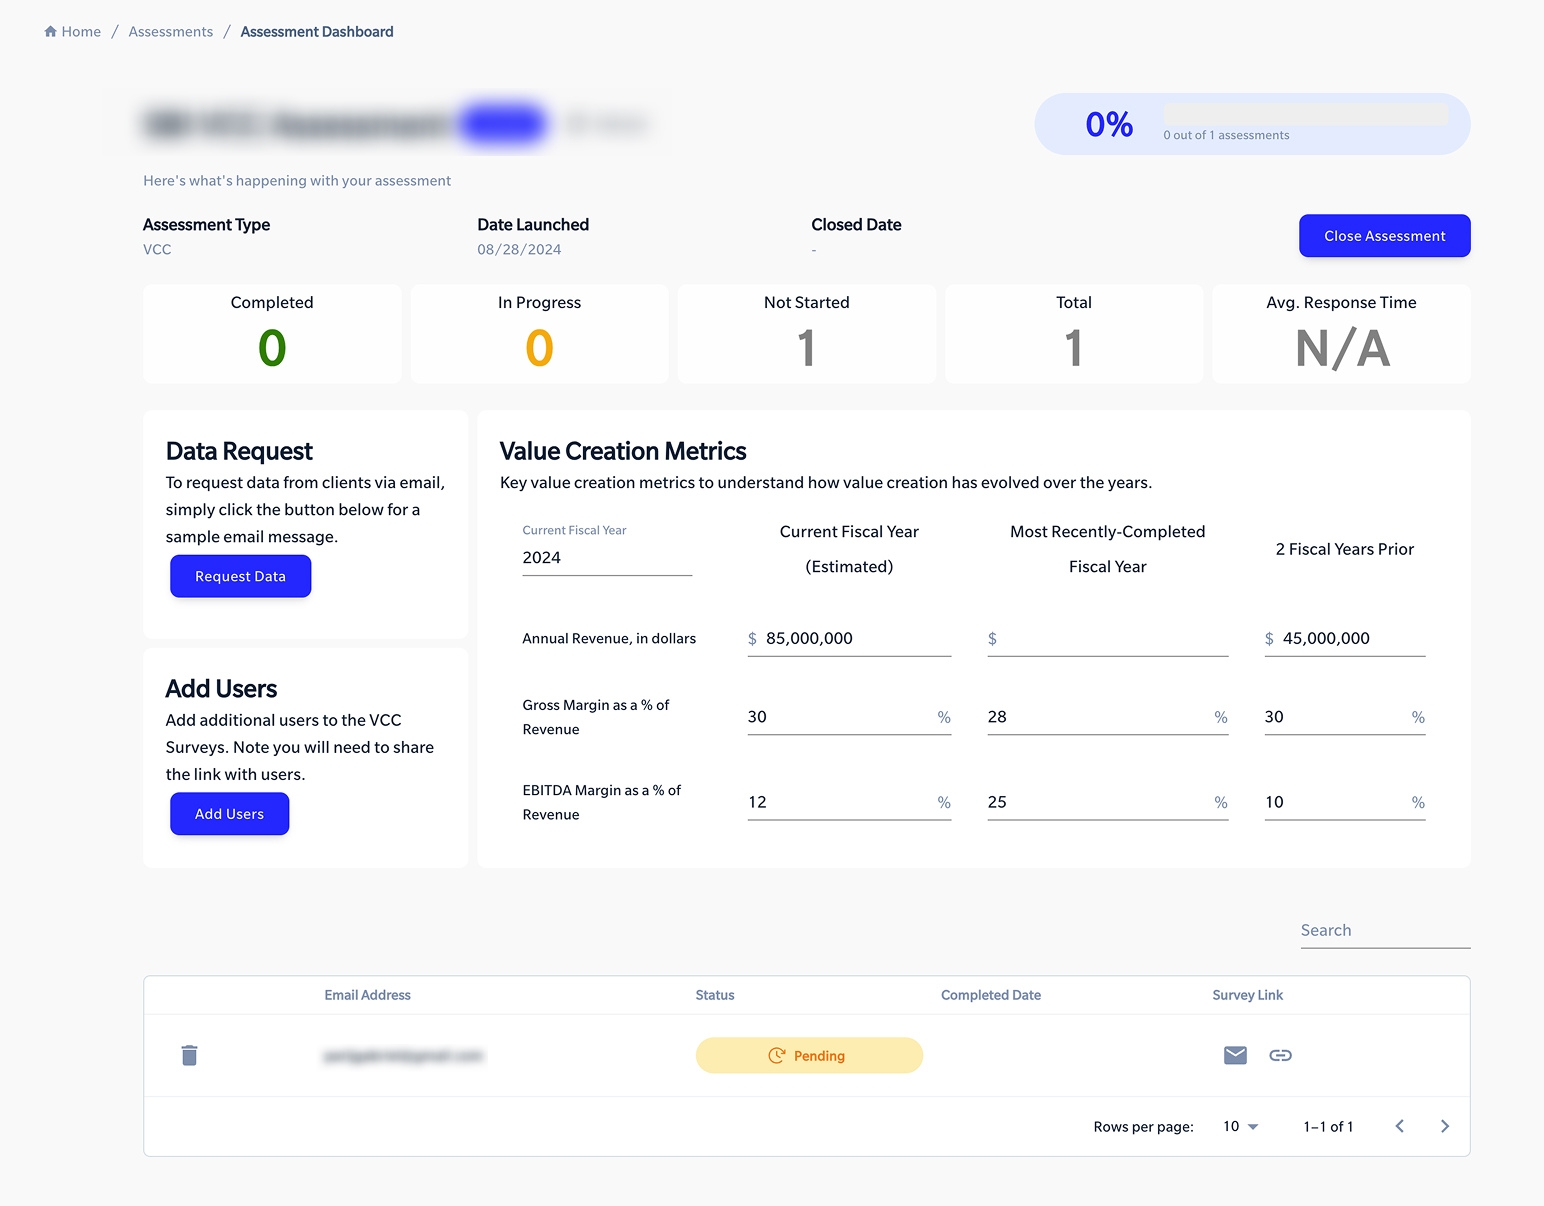
The platform before
Where the work broke down
I interviewed business analysts, decision-makers, internal users, and external partners, and observed live workflow sessions to see where people stalled and which tasks took the most time.
The work followed a predictable sequence: prepare data, compare results, generate reports, interpret signals, turn recommendations into action. Analysts spent most of it gathering and structuring information. The judgment clients paid for came last, and was often rushed. That set the product direction:
- Automate aggregation and structure.
- Keep the evidence visible.
- Leave the recommendation editable.
- Carry the work forward into planning.
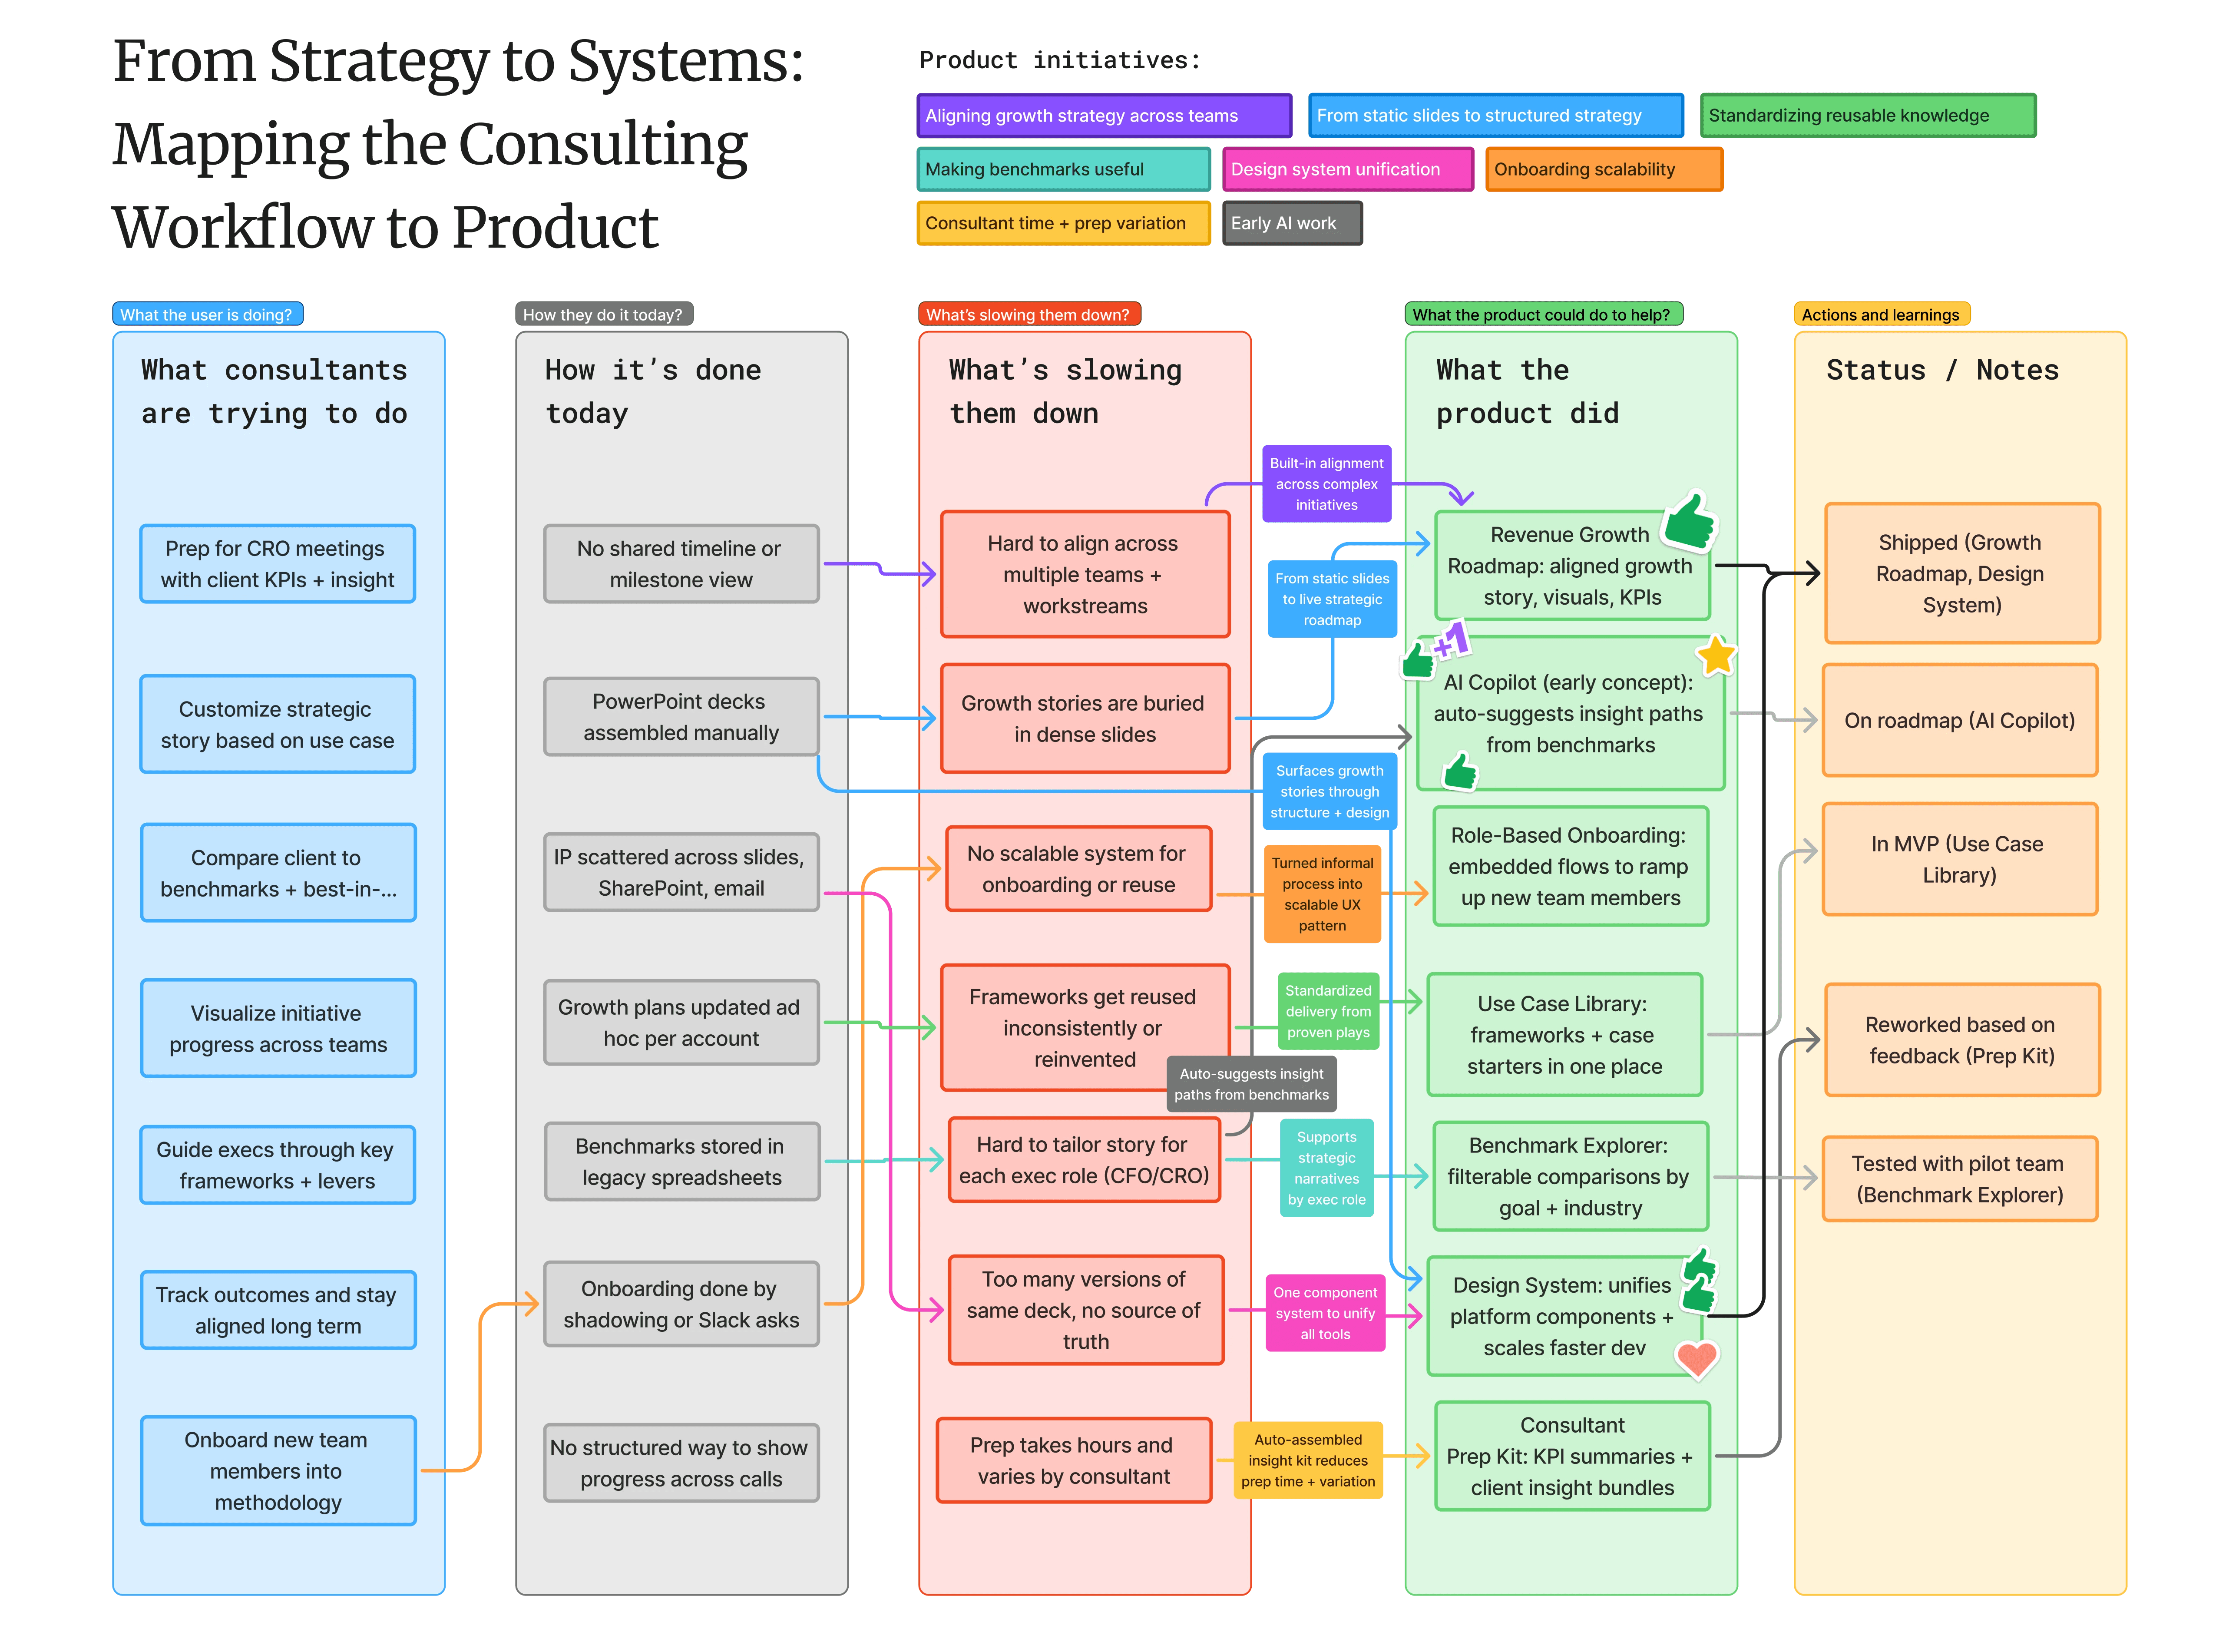
The workflow, mapped
Workflows
Phase 1: digitizing the consulting method
The first phase turned three repeatable consulting frameworks into self-service workflows.
| Workflow | What it digitized | Customer value |
|---|---|---|
| Talent assessment | Individual scorecards, benchmarking, and growth-impact modeling | Evaluate team capability through a consistent framework |
| Selling-time study | Selling-time allocation tied to performance outcomes | See where time goes and what improving it is worth |
| Growth priorities | Growth-lever prioritization by competitive position | Decide what to address first, and why |
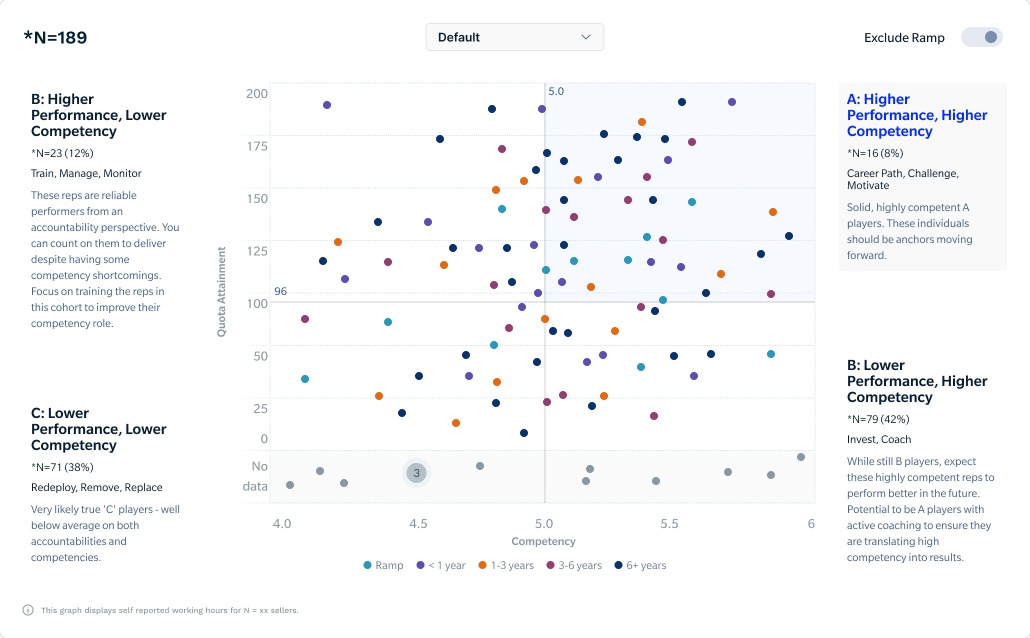
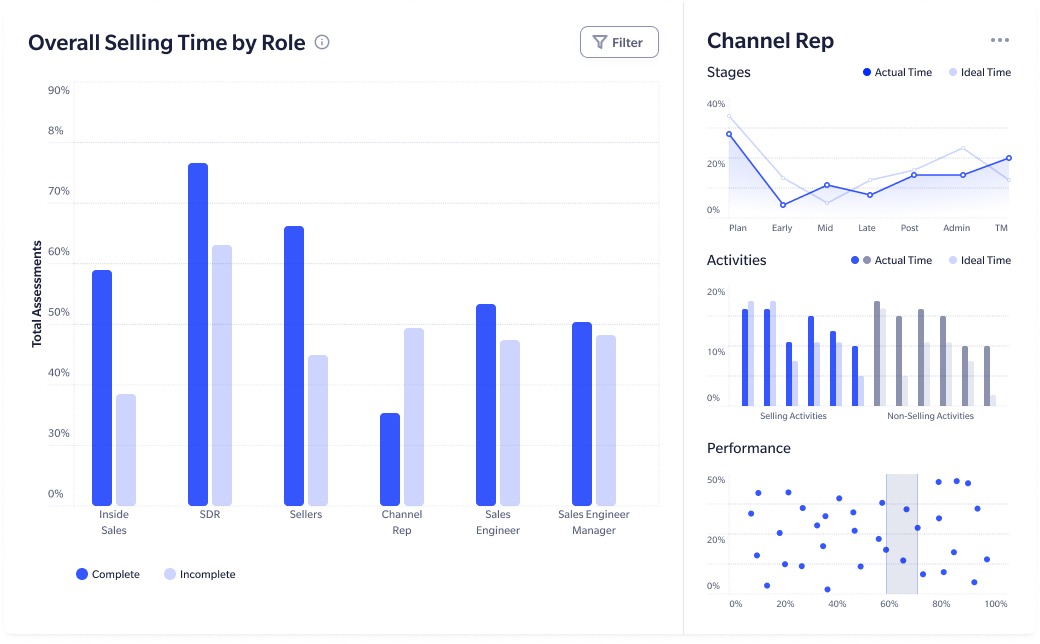
Talent assessment and selling time
Roadmap
Phase 2: one growth plan instead of separate tools
The three workflows produced useful scores, but customers still needed to know what to do next. Progress depended on personal initiative and an advisor’s guidance. I designed a growth roadmap to put that progression inside the platform. It shows clients:
- their current position in the growth plan and which assessments come next
- current scores, and the training and initiatives they require
- completed, upcoming, and outstanding work, with owners, stages, and progress
Outputs from the three workflows fed one connected plan. The roadmap turned separate analyses into a guided operating workflow, and gave clients a reason to return as the plan moved.
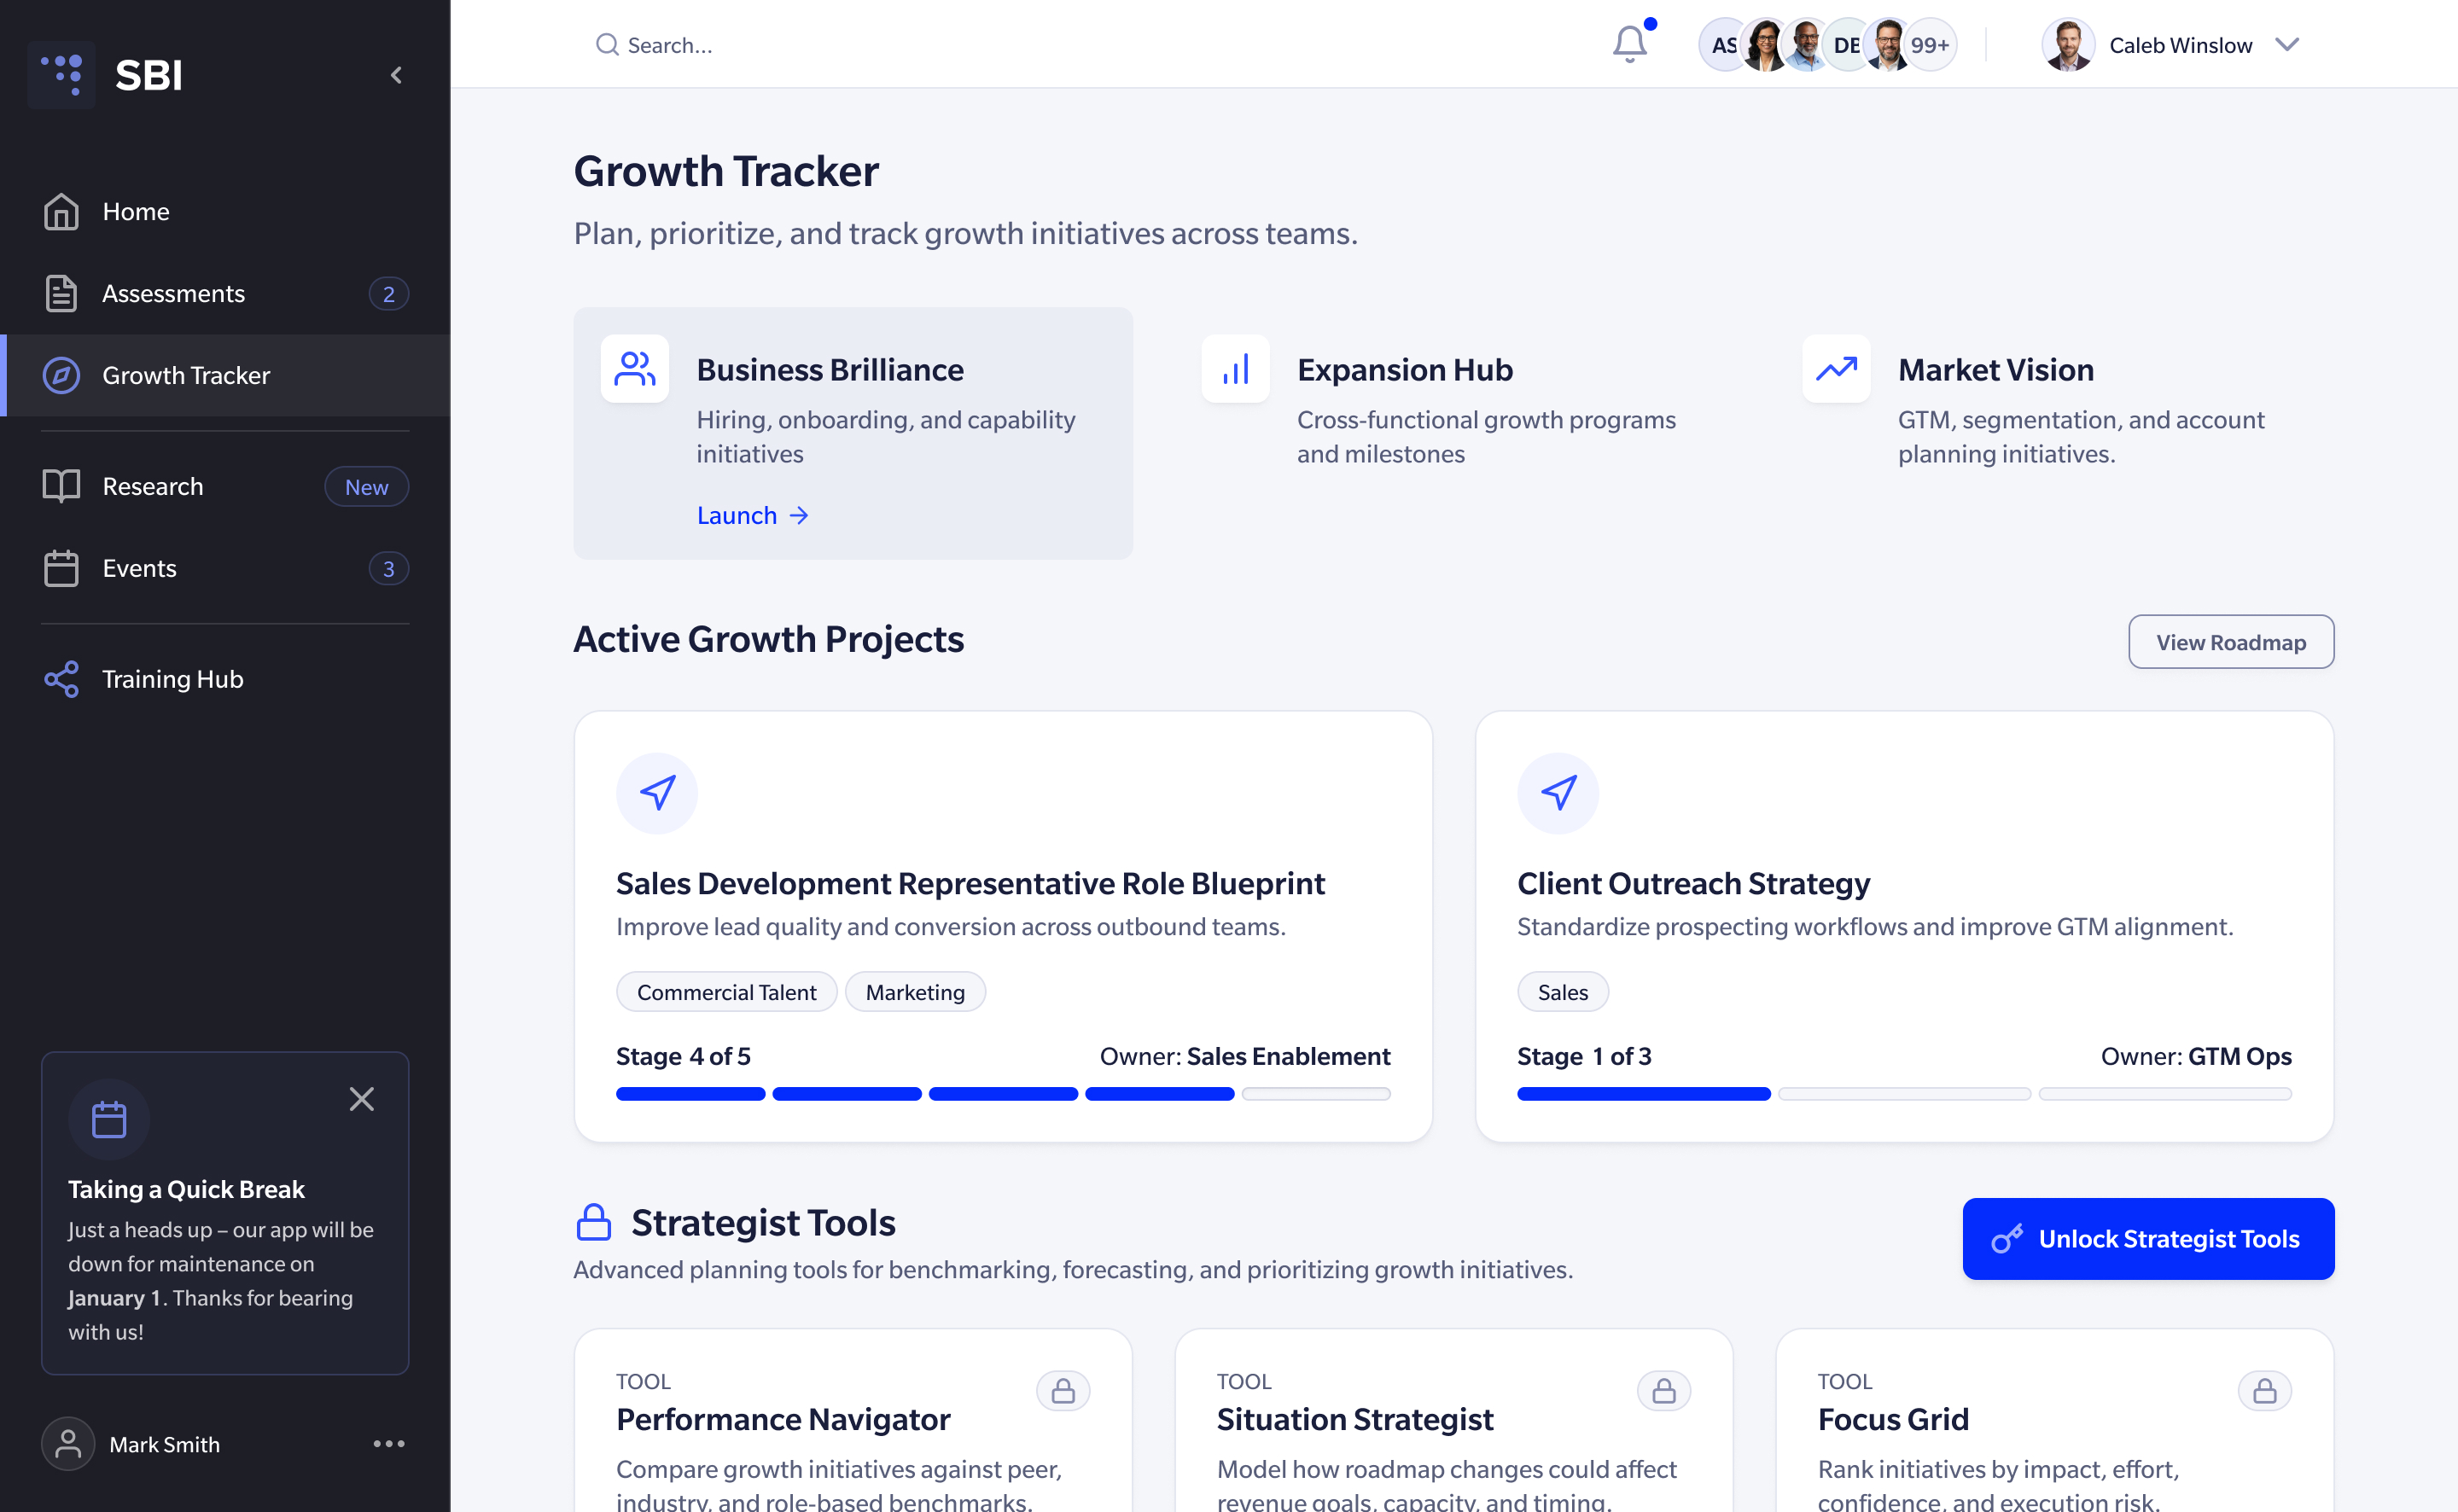
The growth tracker
Phase 3: AI without removing expert control
The platform then added AI-assisted analysis and reporting. A user selects the business context, connects data, chooses a growth lever, and receives a structured recommendation with sources, calculations, and suggested next actions, editable and connected to roadmap work. The design challenge was trust.
| Product decision | User value |
|---|---|
| Source visibility | See which data informed each recommendation |
| Signal quality | Sourced findings, estimates, and items requiring review are distinct |
| Direct editing | Revise a recommendation without rebuilding the analysis |
| Action continuity | Recommendations move into roadmap items instead of ending as a report |
I rejected a fully automated recommendation flow: it removed the analyst judgment customers relied on. The final approach encoded the repeatable method and kept interpretation visible and editable.
The first AI experience worked inline. A user chose a workstream template up front, then prompted the AI inside the page and got the result back in place.
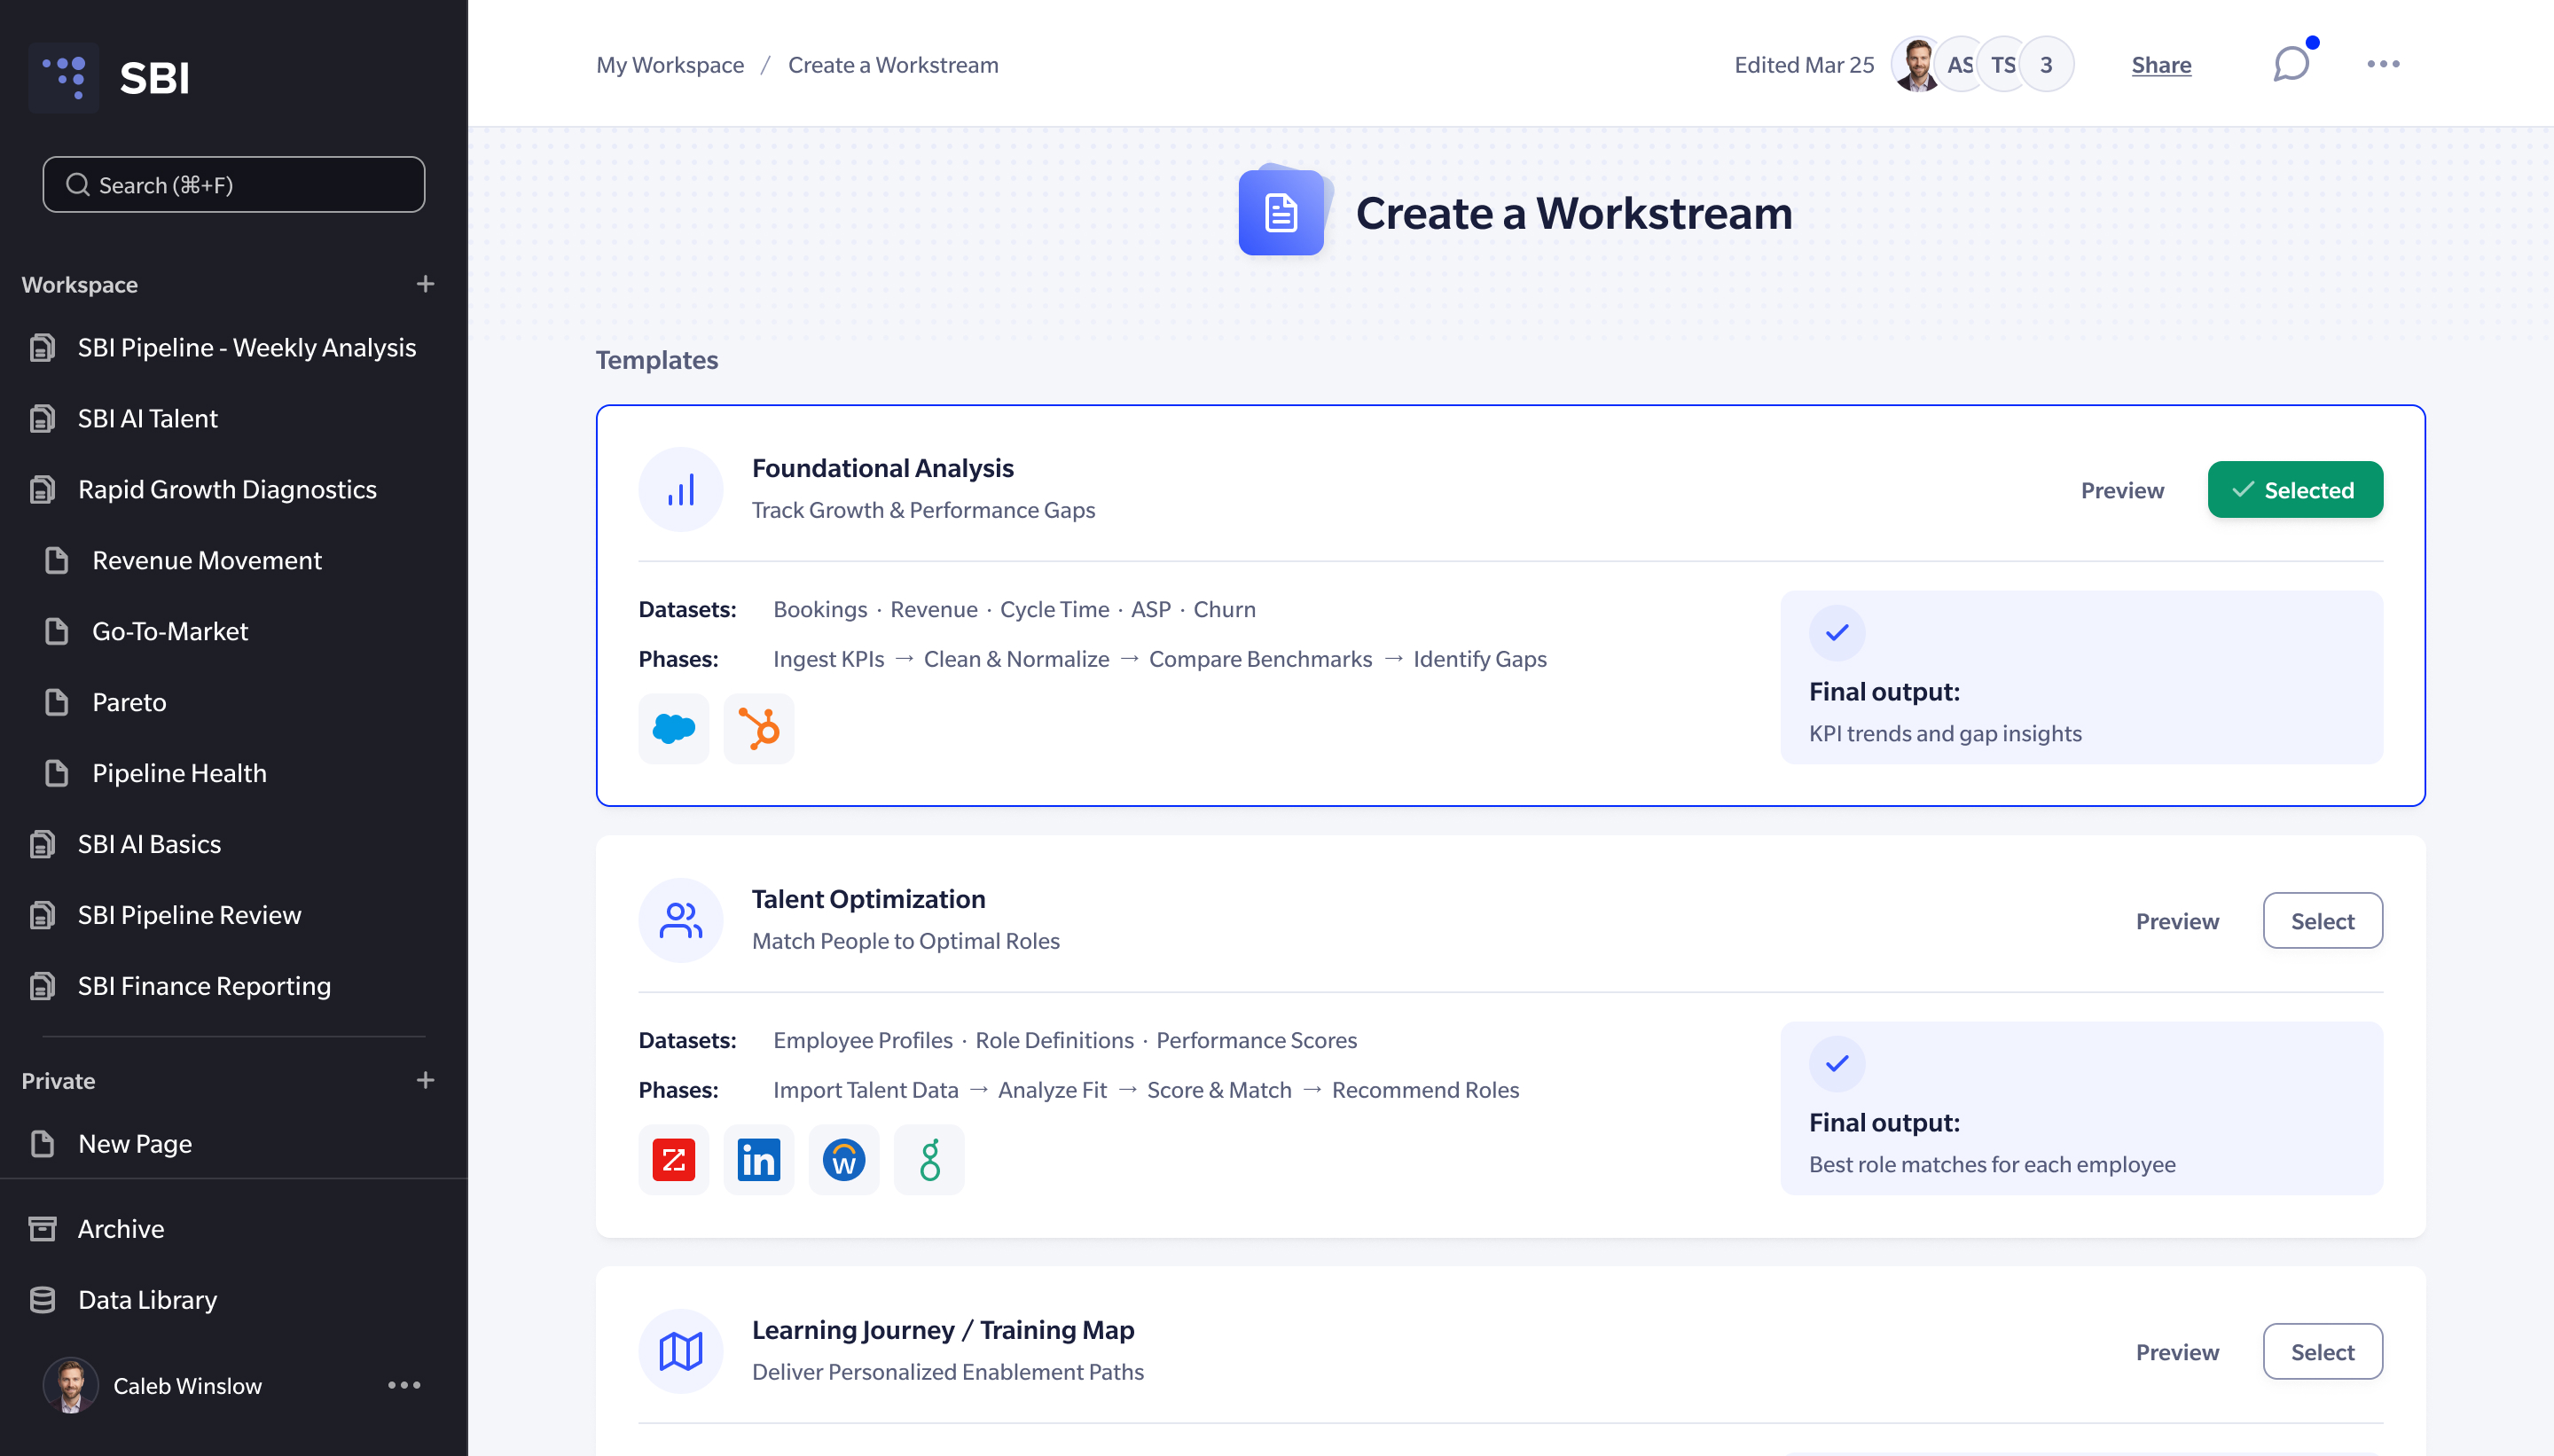
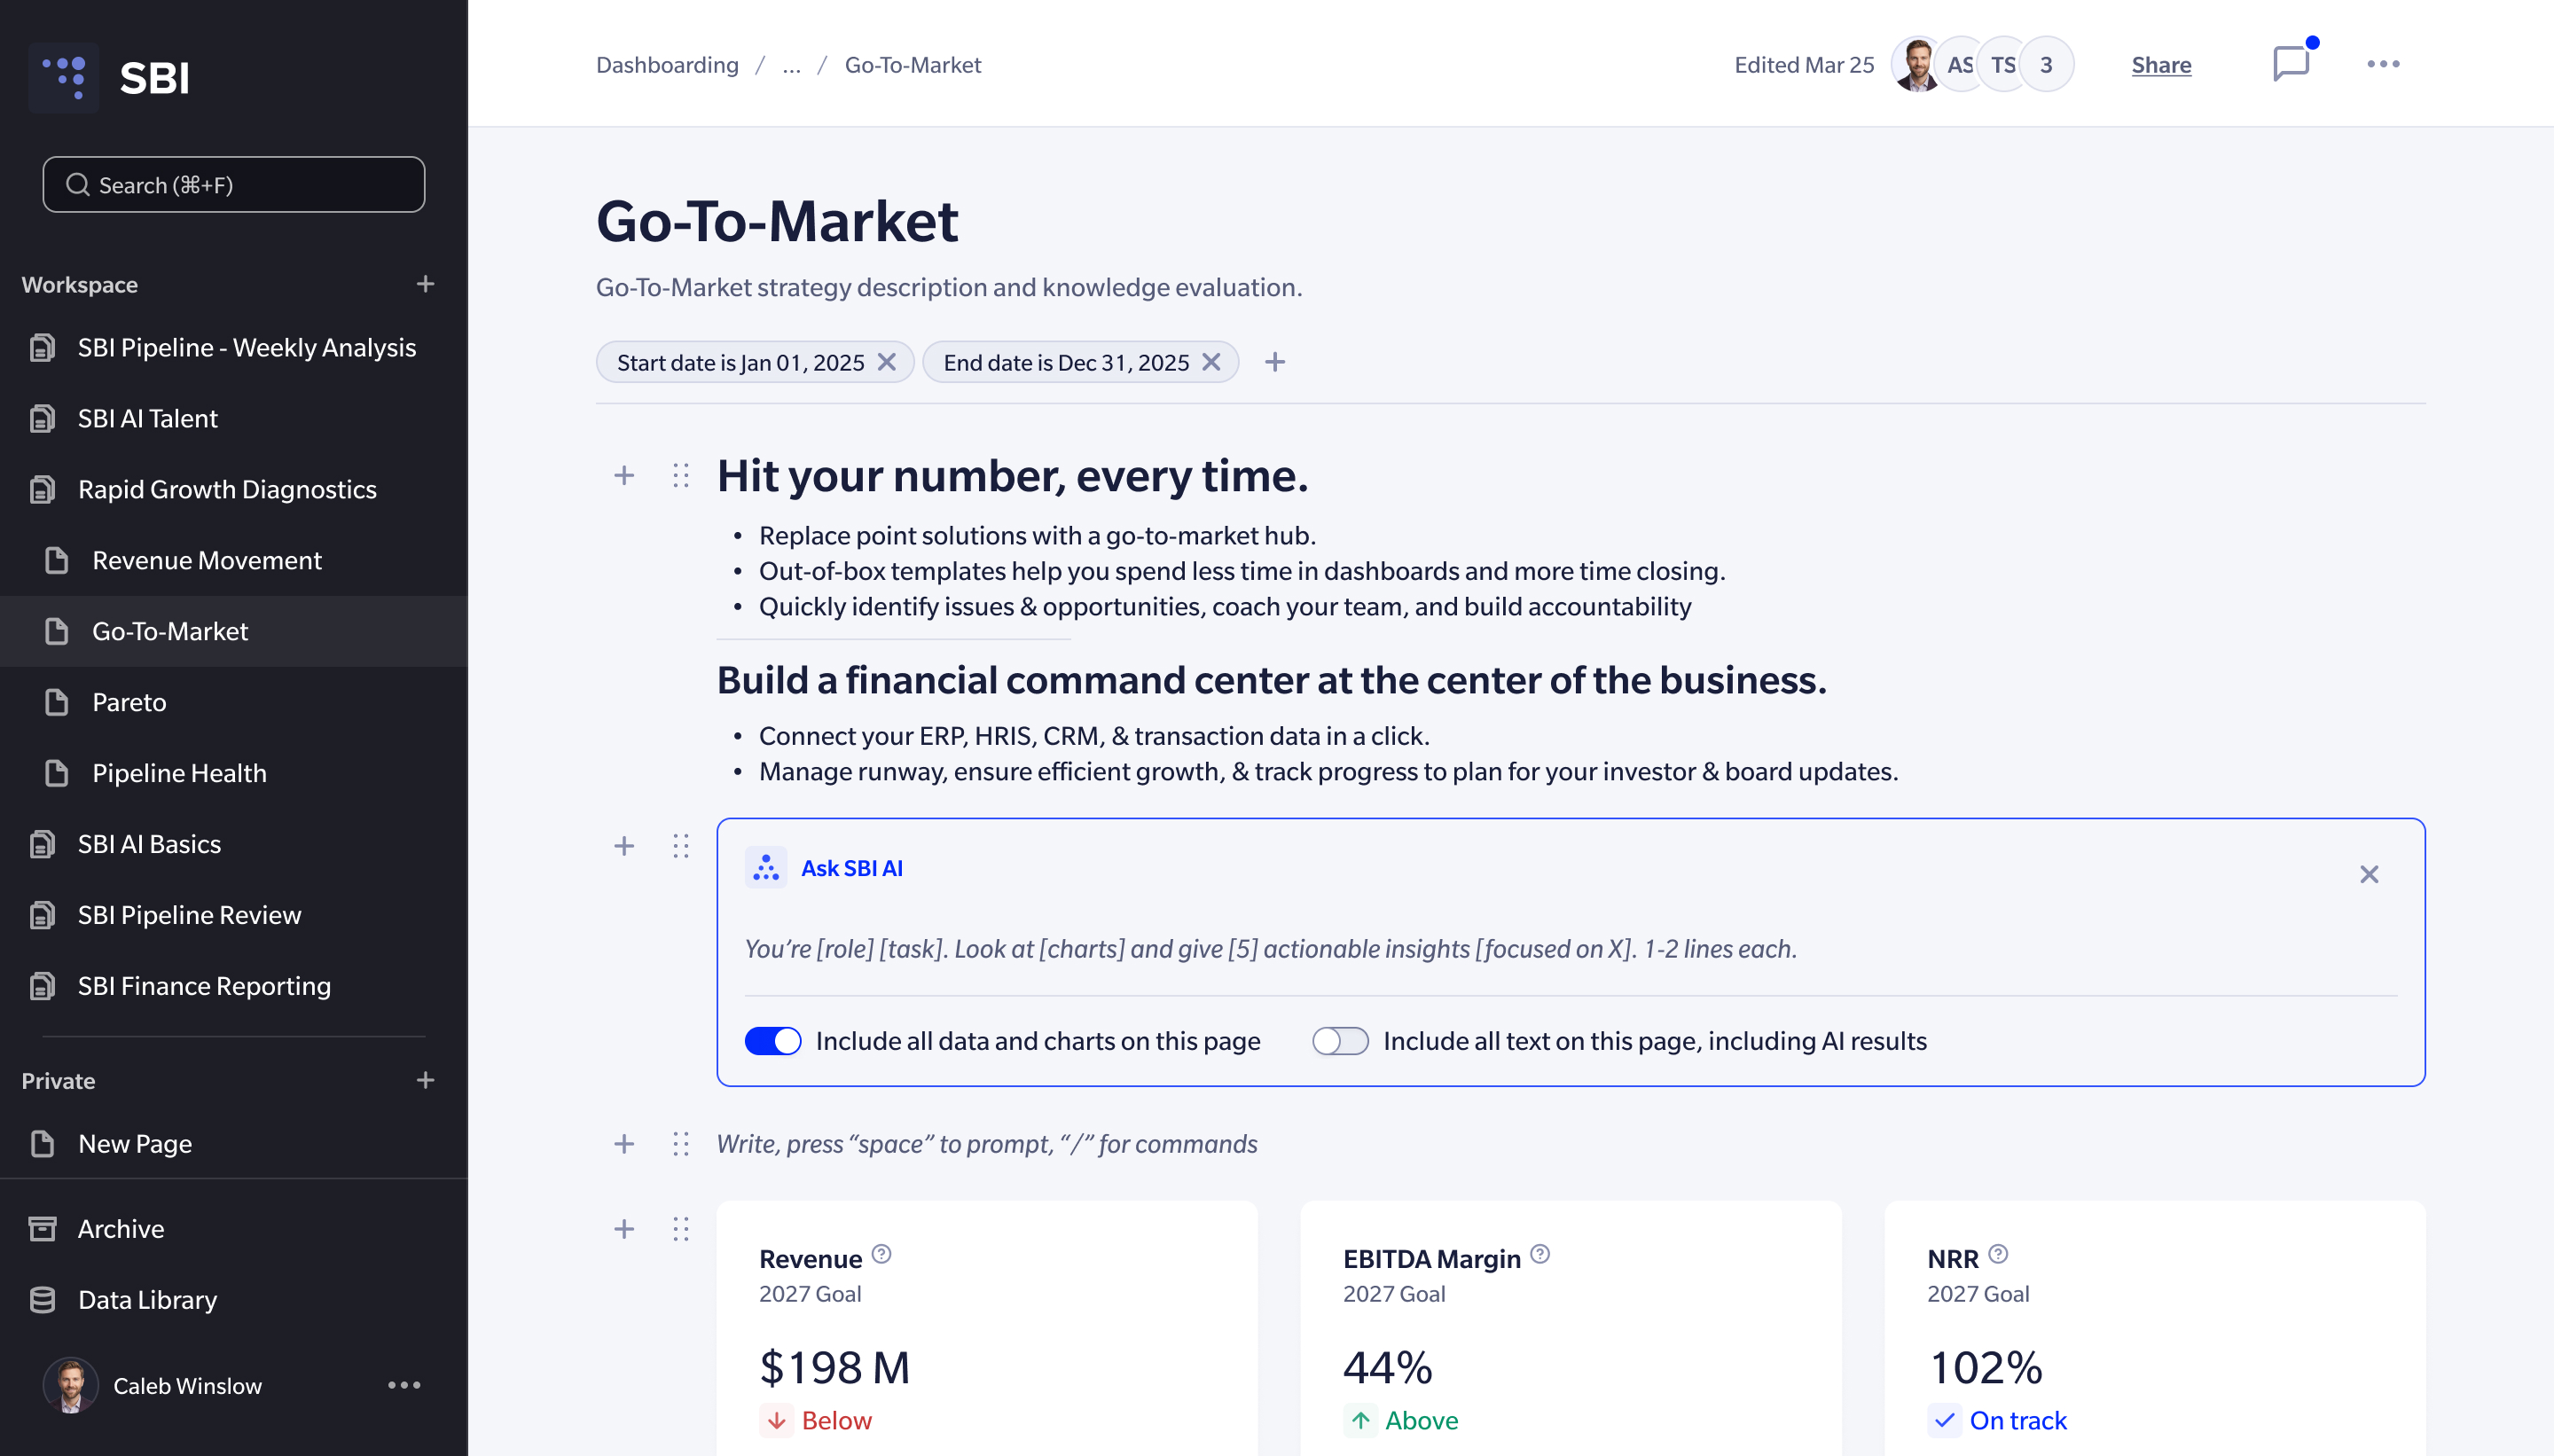
Phase 3: templates and prompts
Production use showed its limits. The template forced decisions before the question was clear, and each prompt was a one-off: refining an analysis meant restating the context.
Phase 4: an assistant beside the work
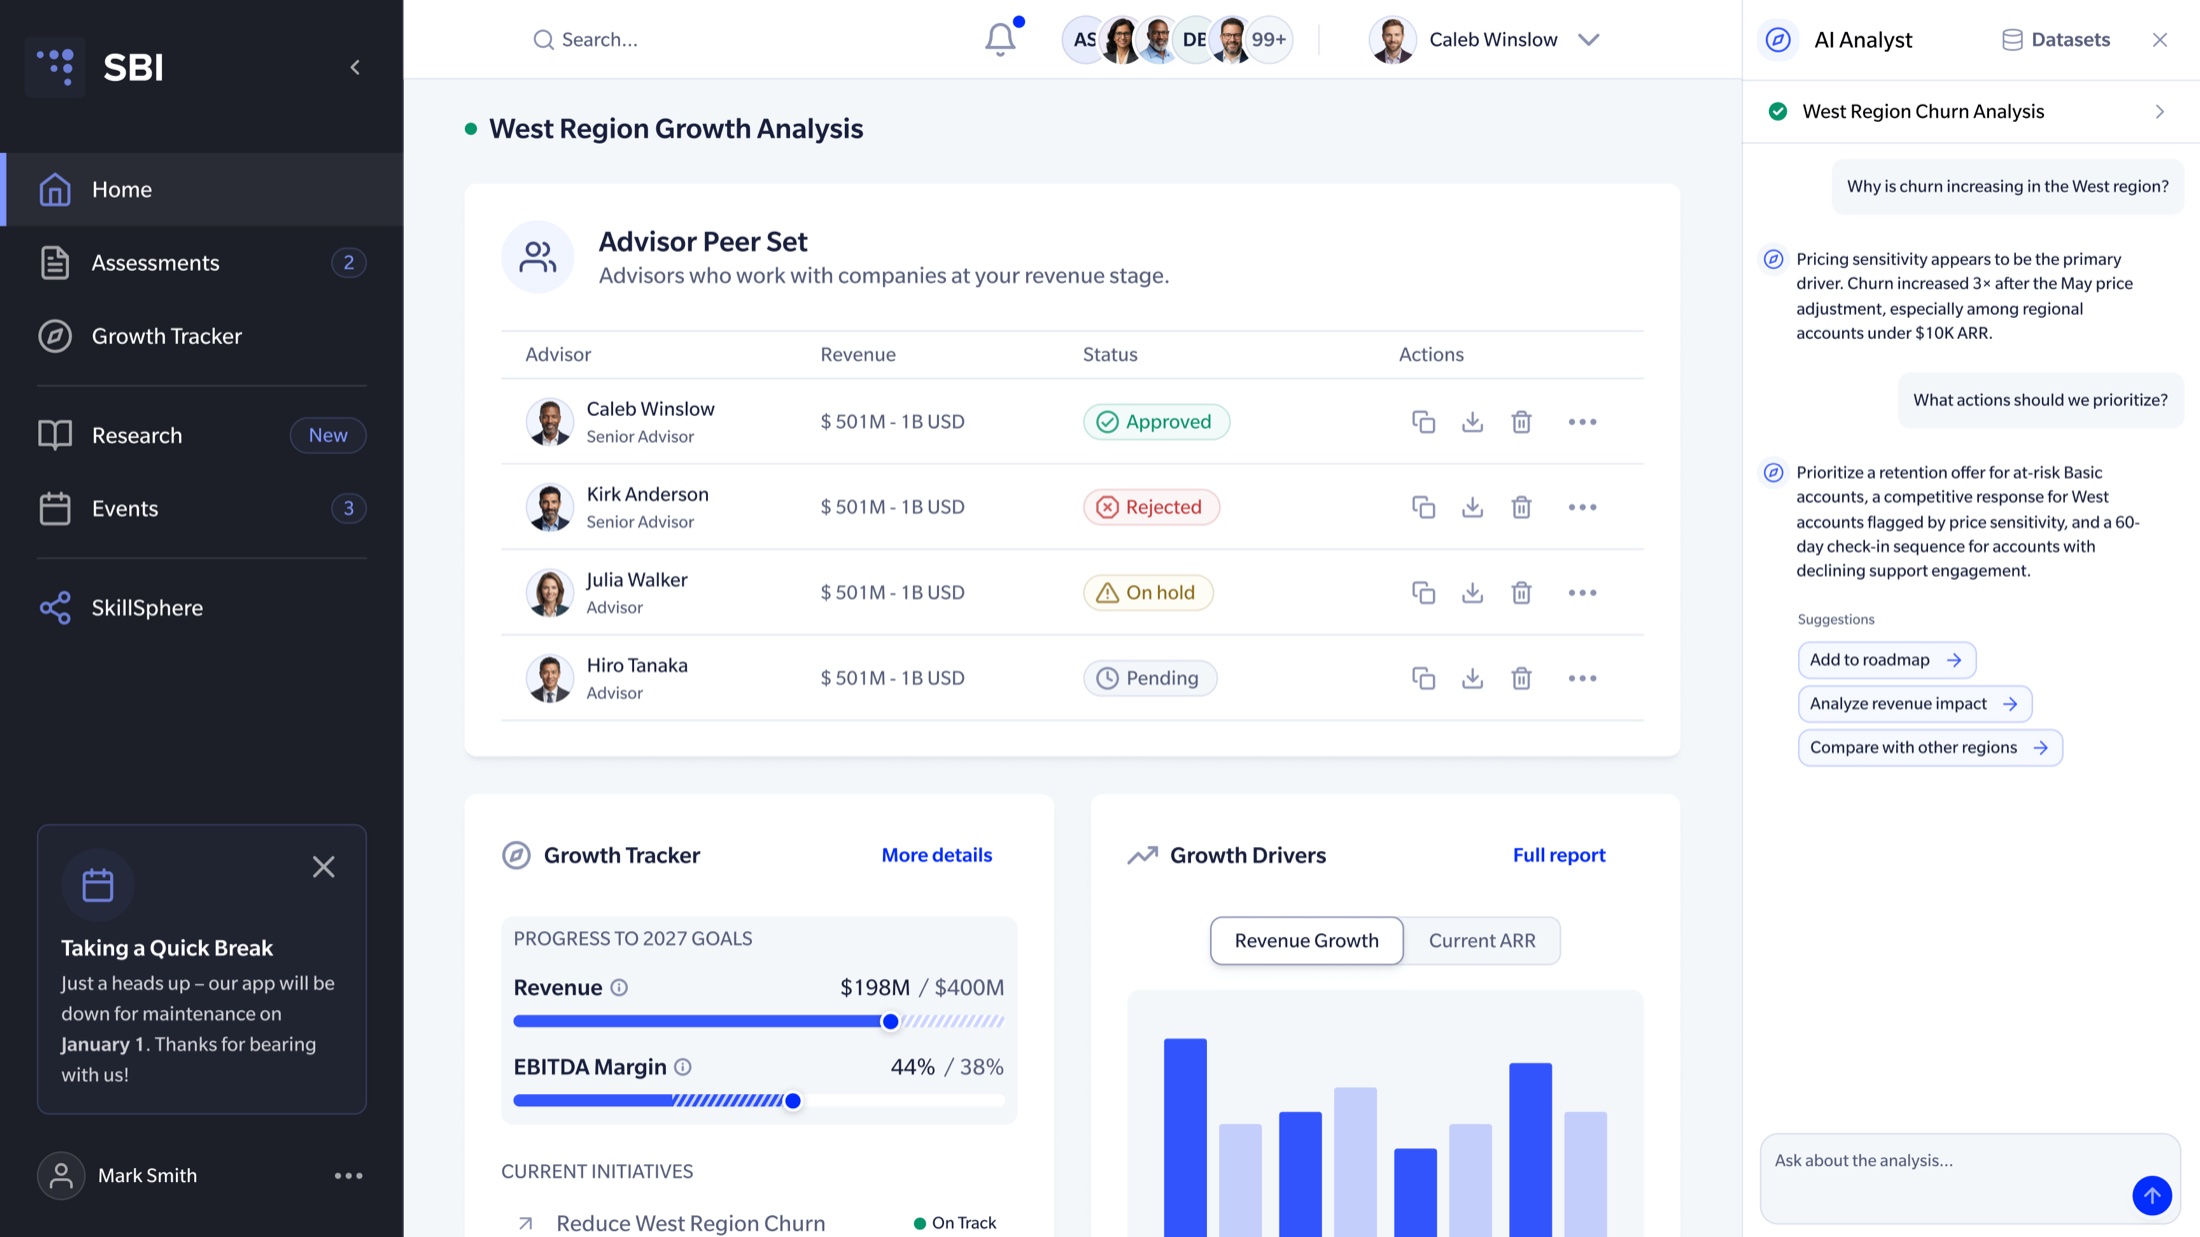
The next phase moved the AI into a conversation beside the page, because conversation was the better entry point while the question was still forming. It kept what phase 3 got right. Templates stayed, but as suggestions inside the conversation instead of a required first step. The assistant shows each step, from collecting data to creating a dataset, so the analyst can see what went into a result before trusting it. Pages and datasets can be referenced with @, and every dataset the assistant creates is saved for the next analysis, so chat became one layer of the workspace rather than all of it.
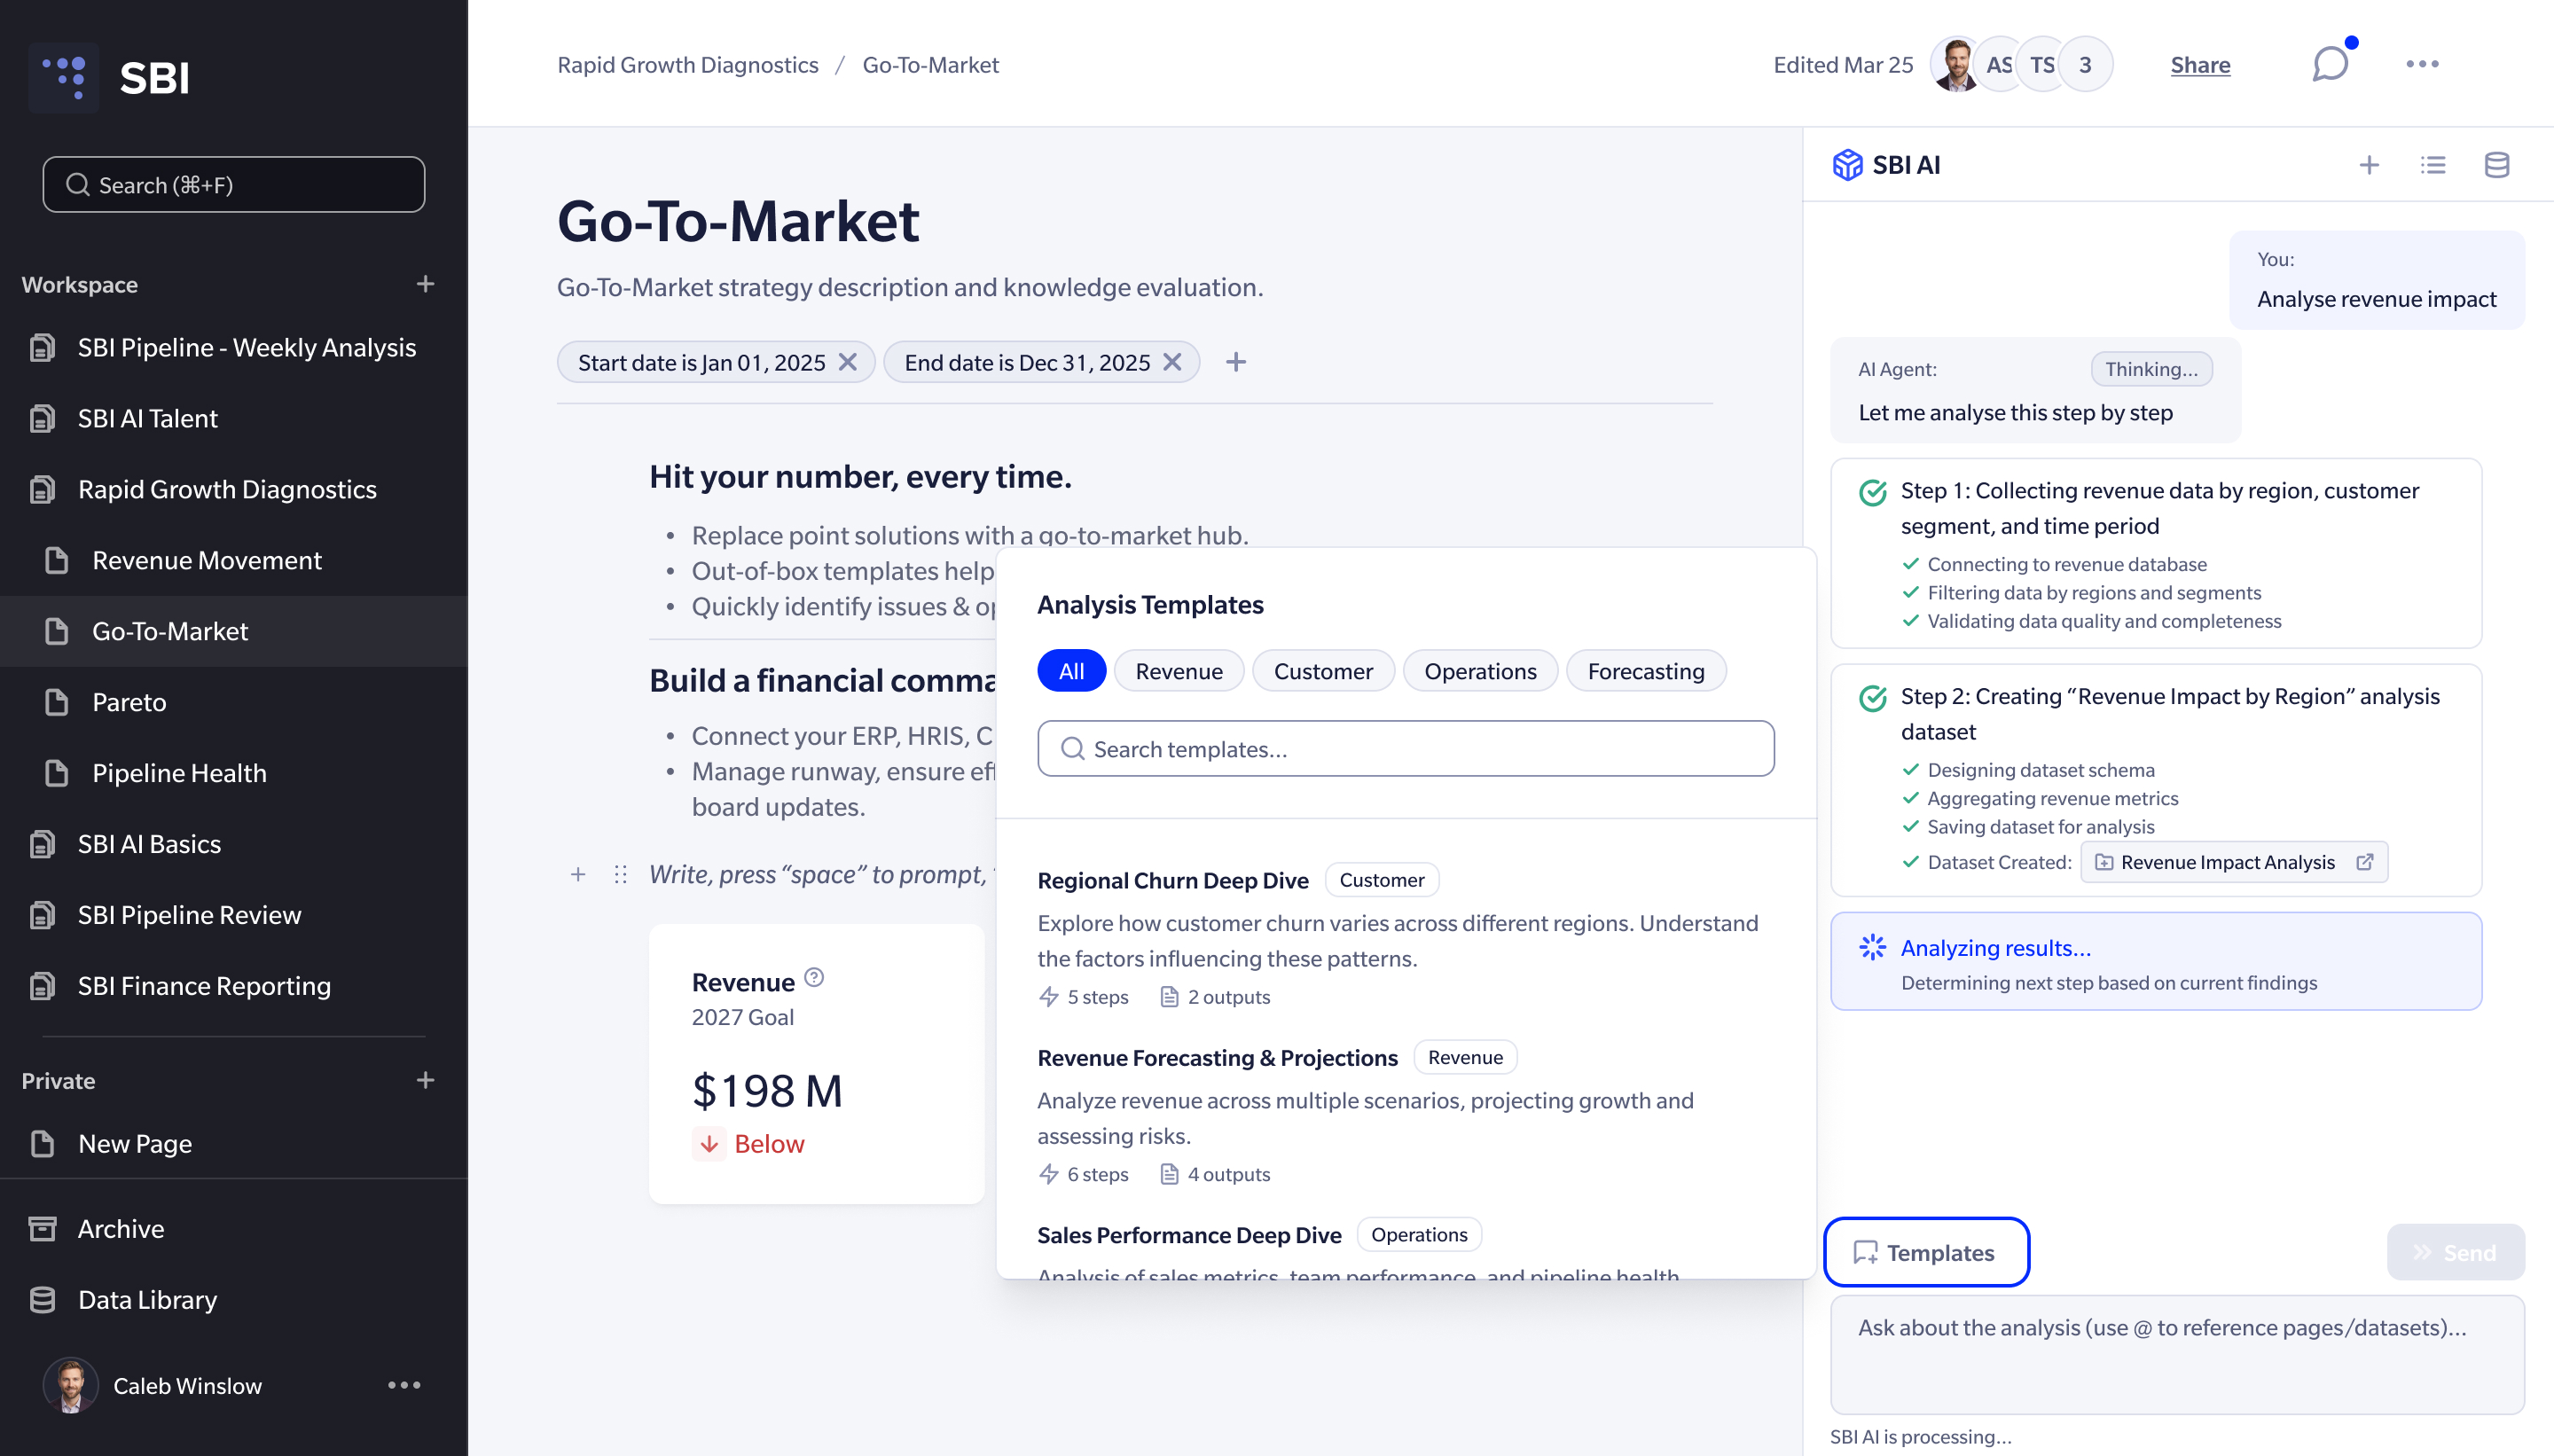
Phase 4: the assistant
Later, at S&P Global, I met the reverse problem: structured work forced through chat (opens in a new tab).
One foundation for the portfolio
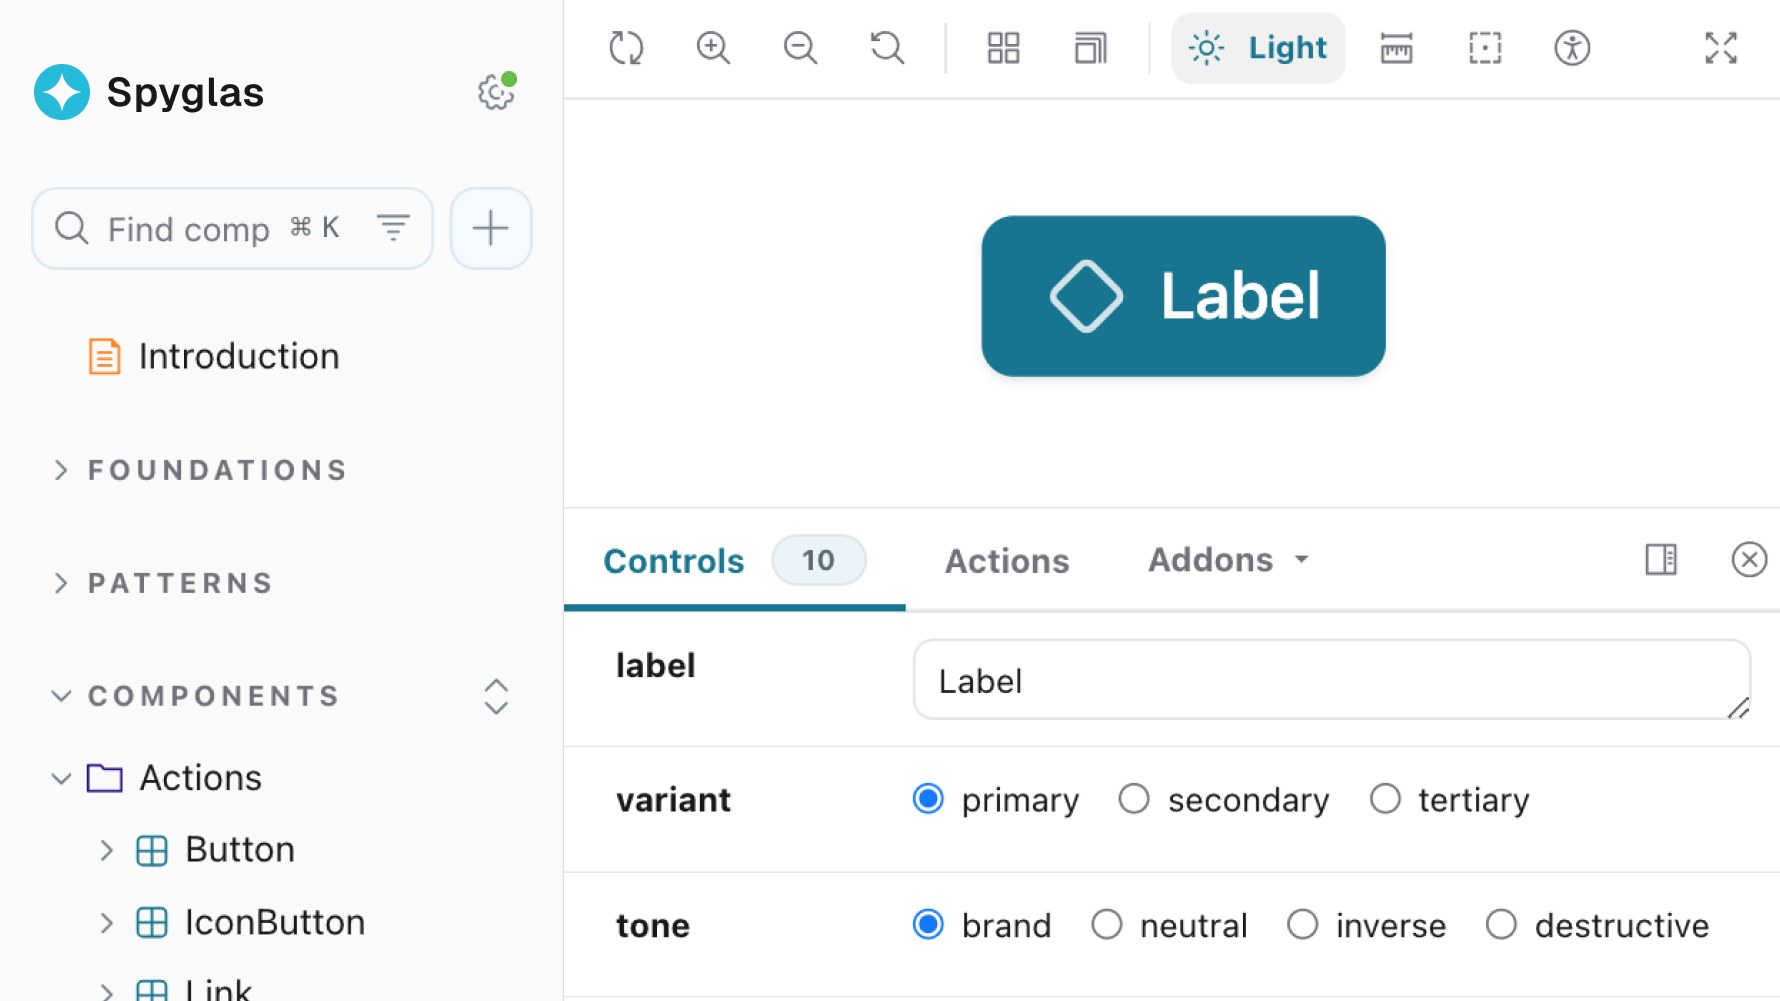
As the sole designer, I built a 40-component system across the product portfolio: shared tokens, light and dark analytical environments, chart and table patterns, status states, navigation, and dense dashboard layouts. Standardization covered repeated behavior; product-specific patterns stayed local where they needed to.
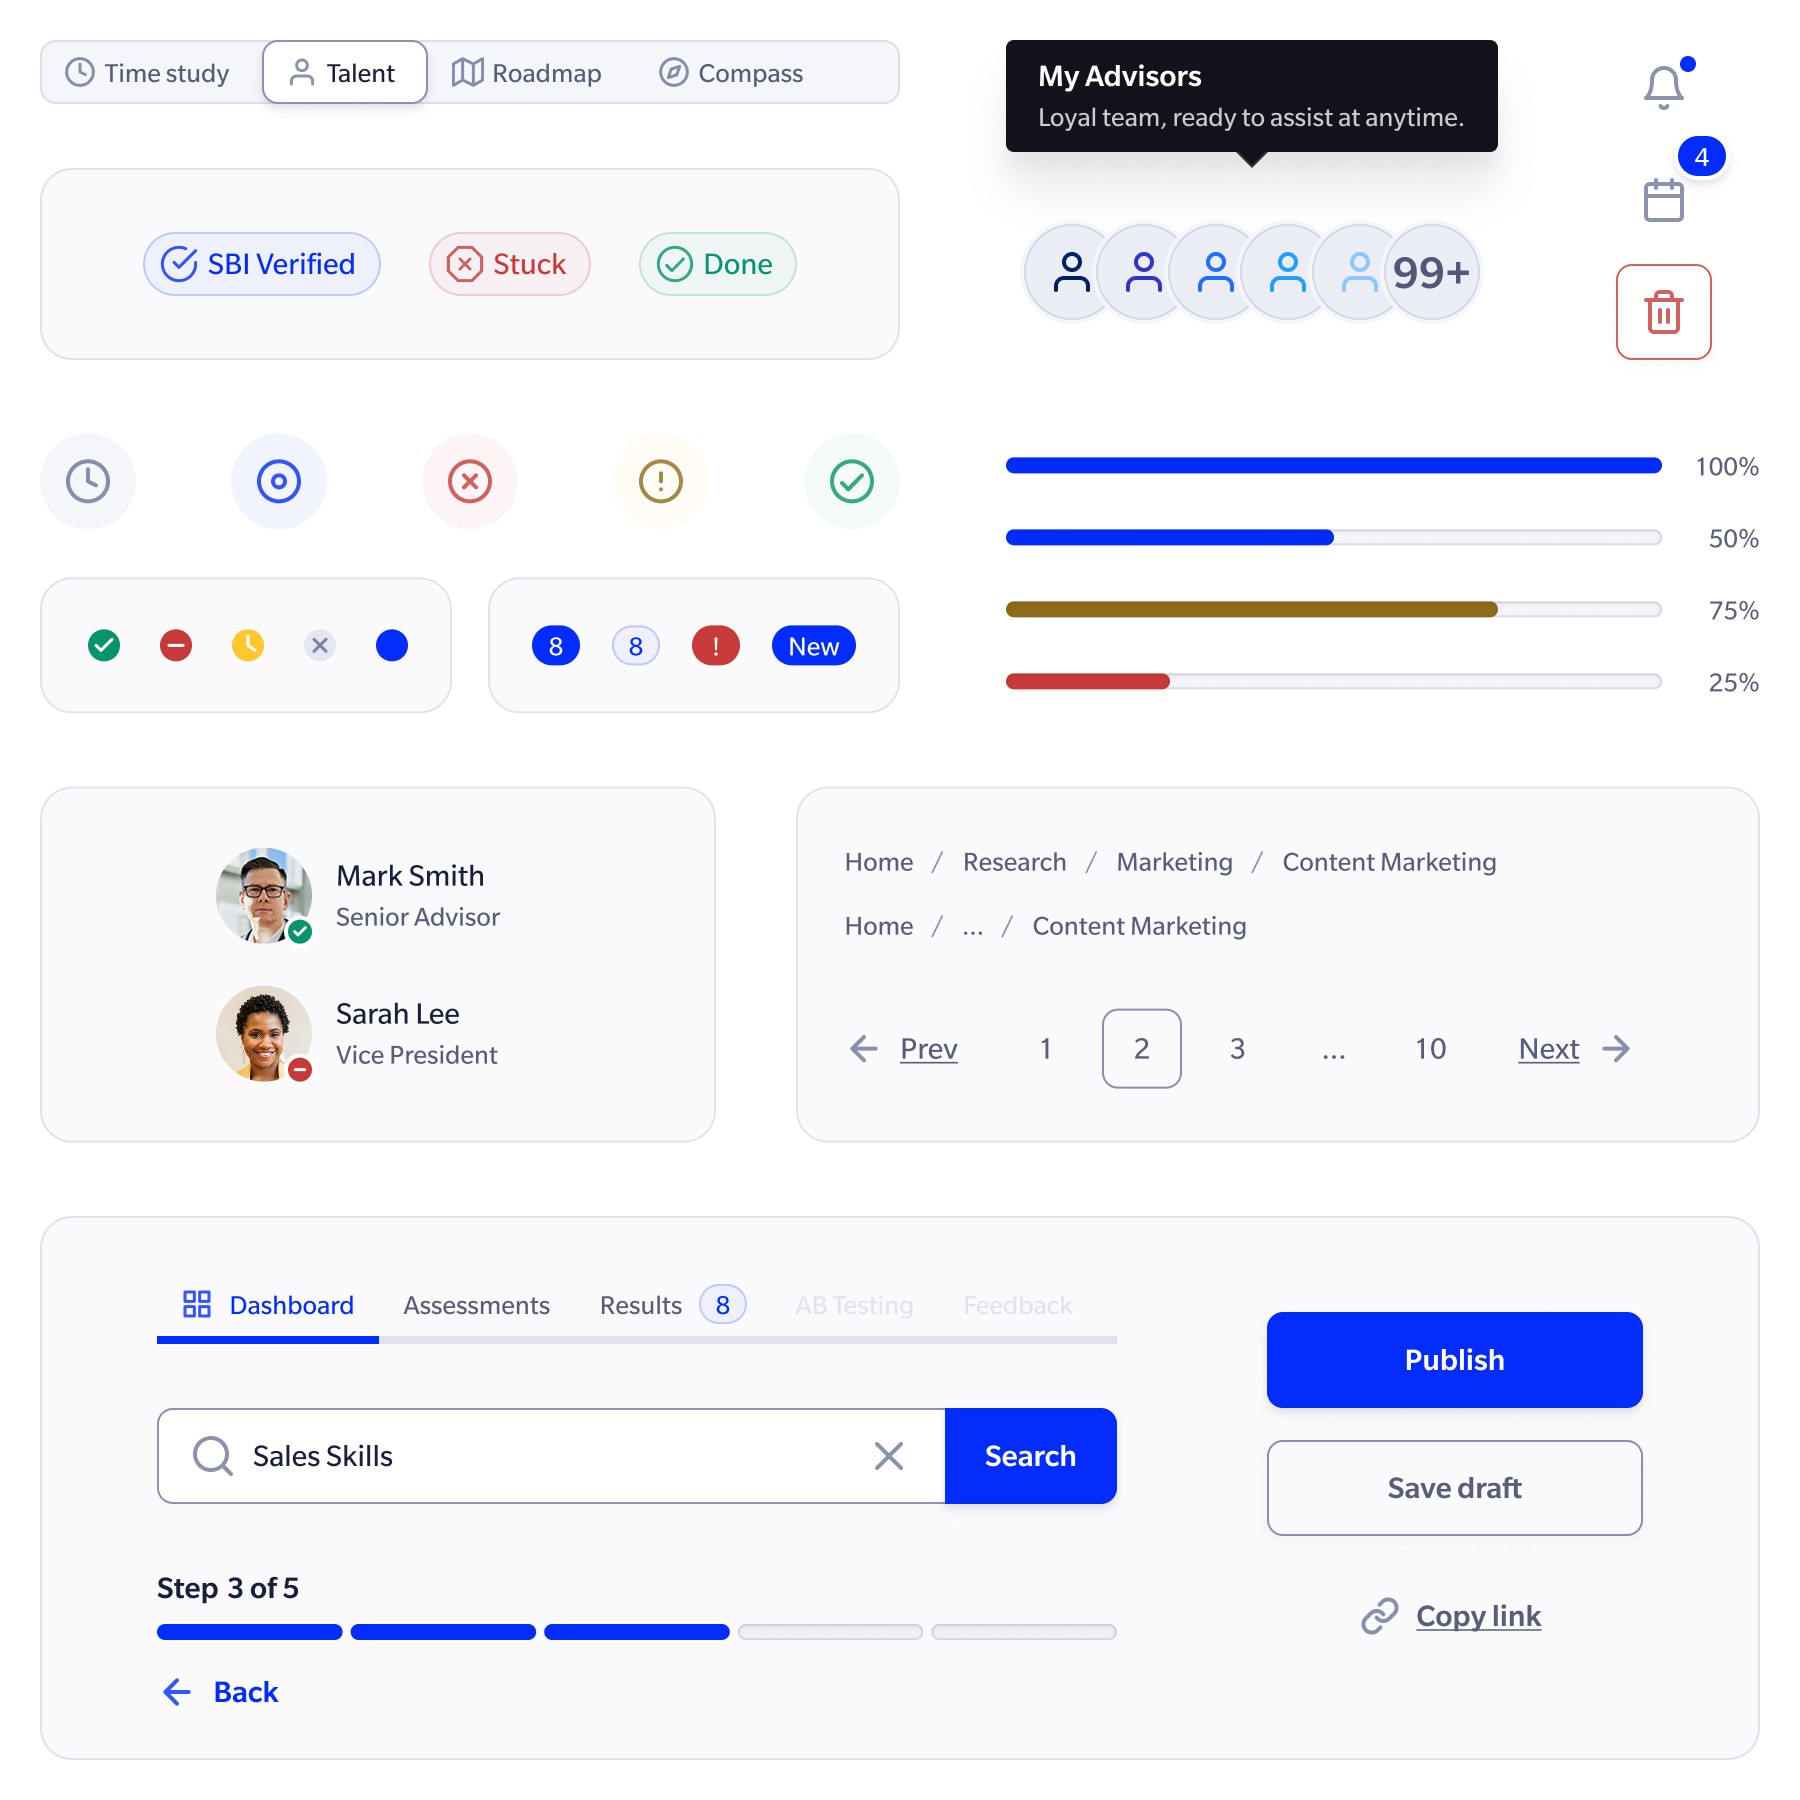
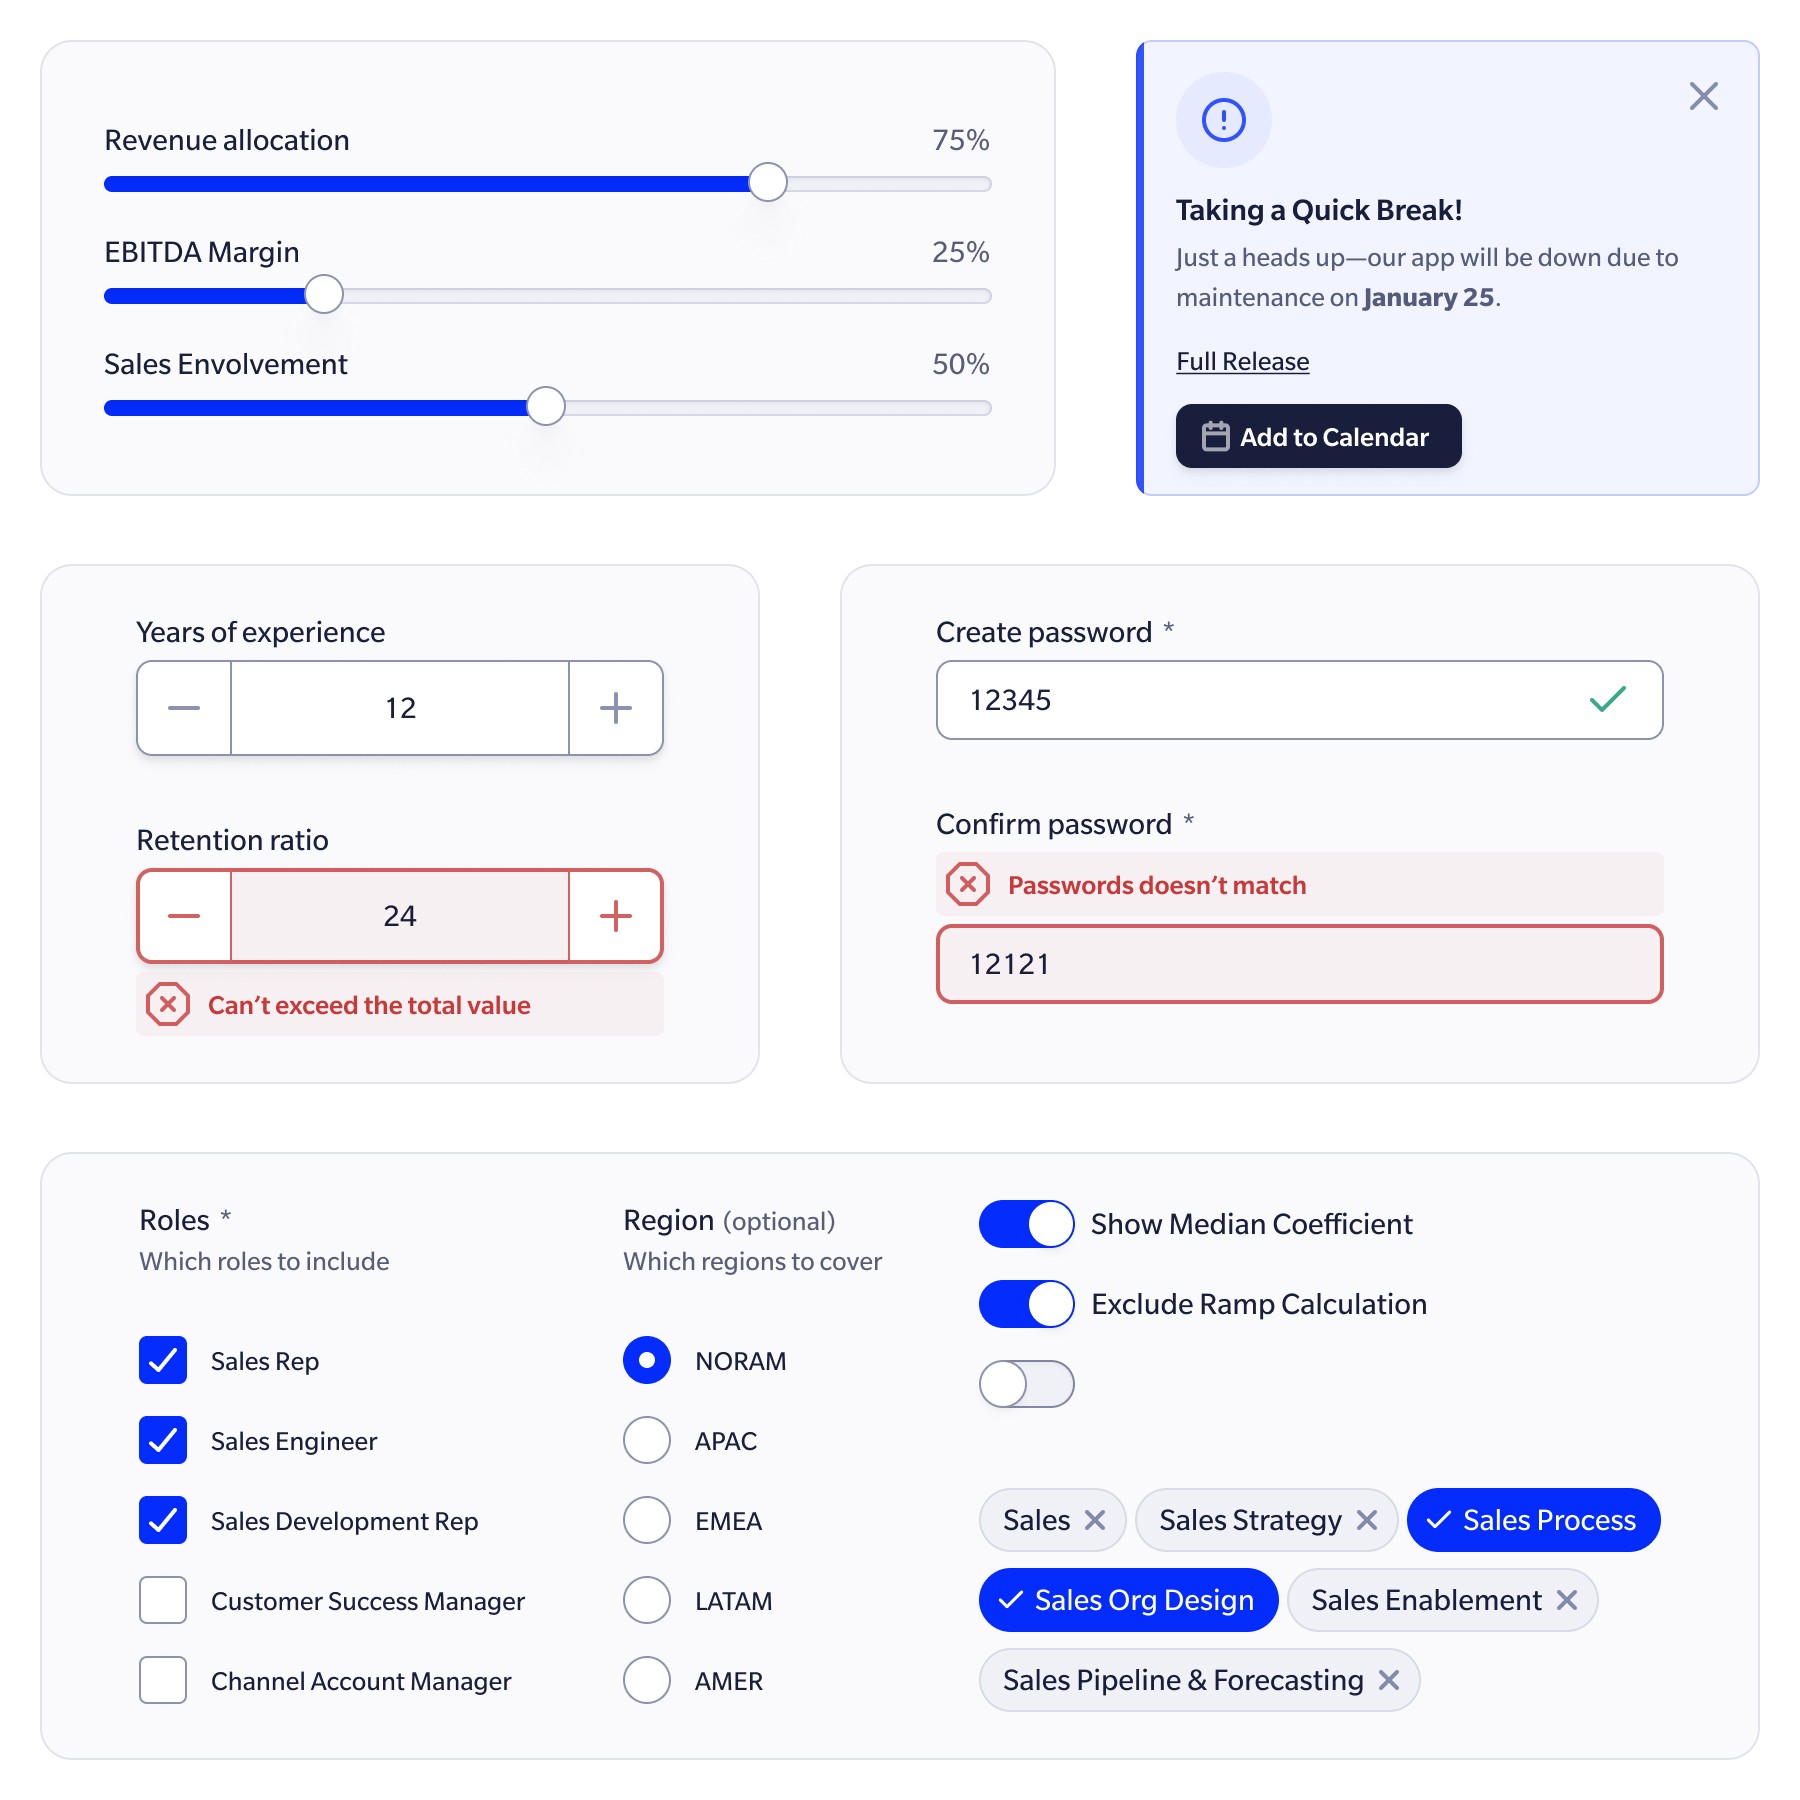
One library, two products
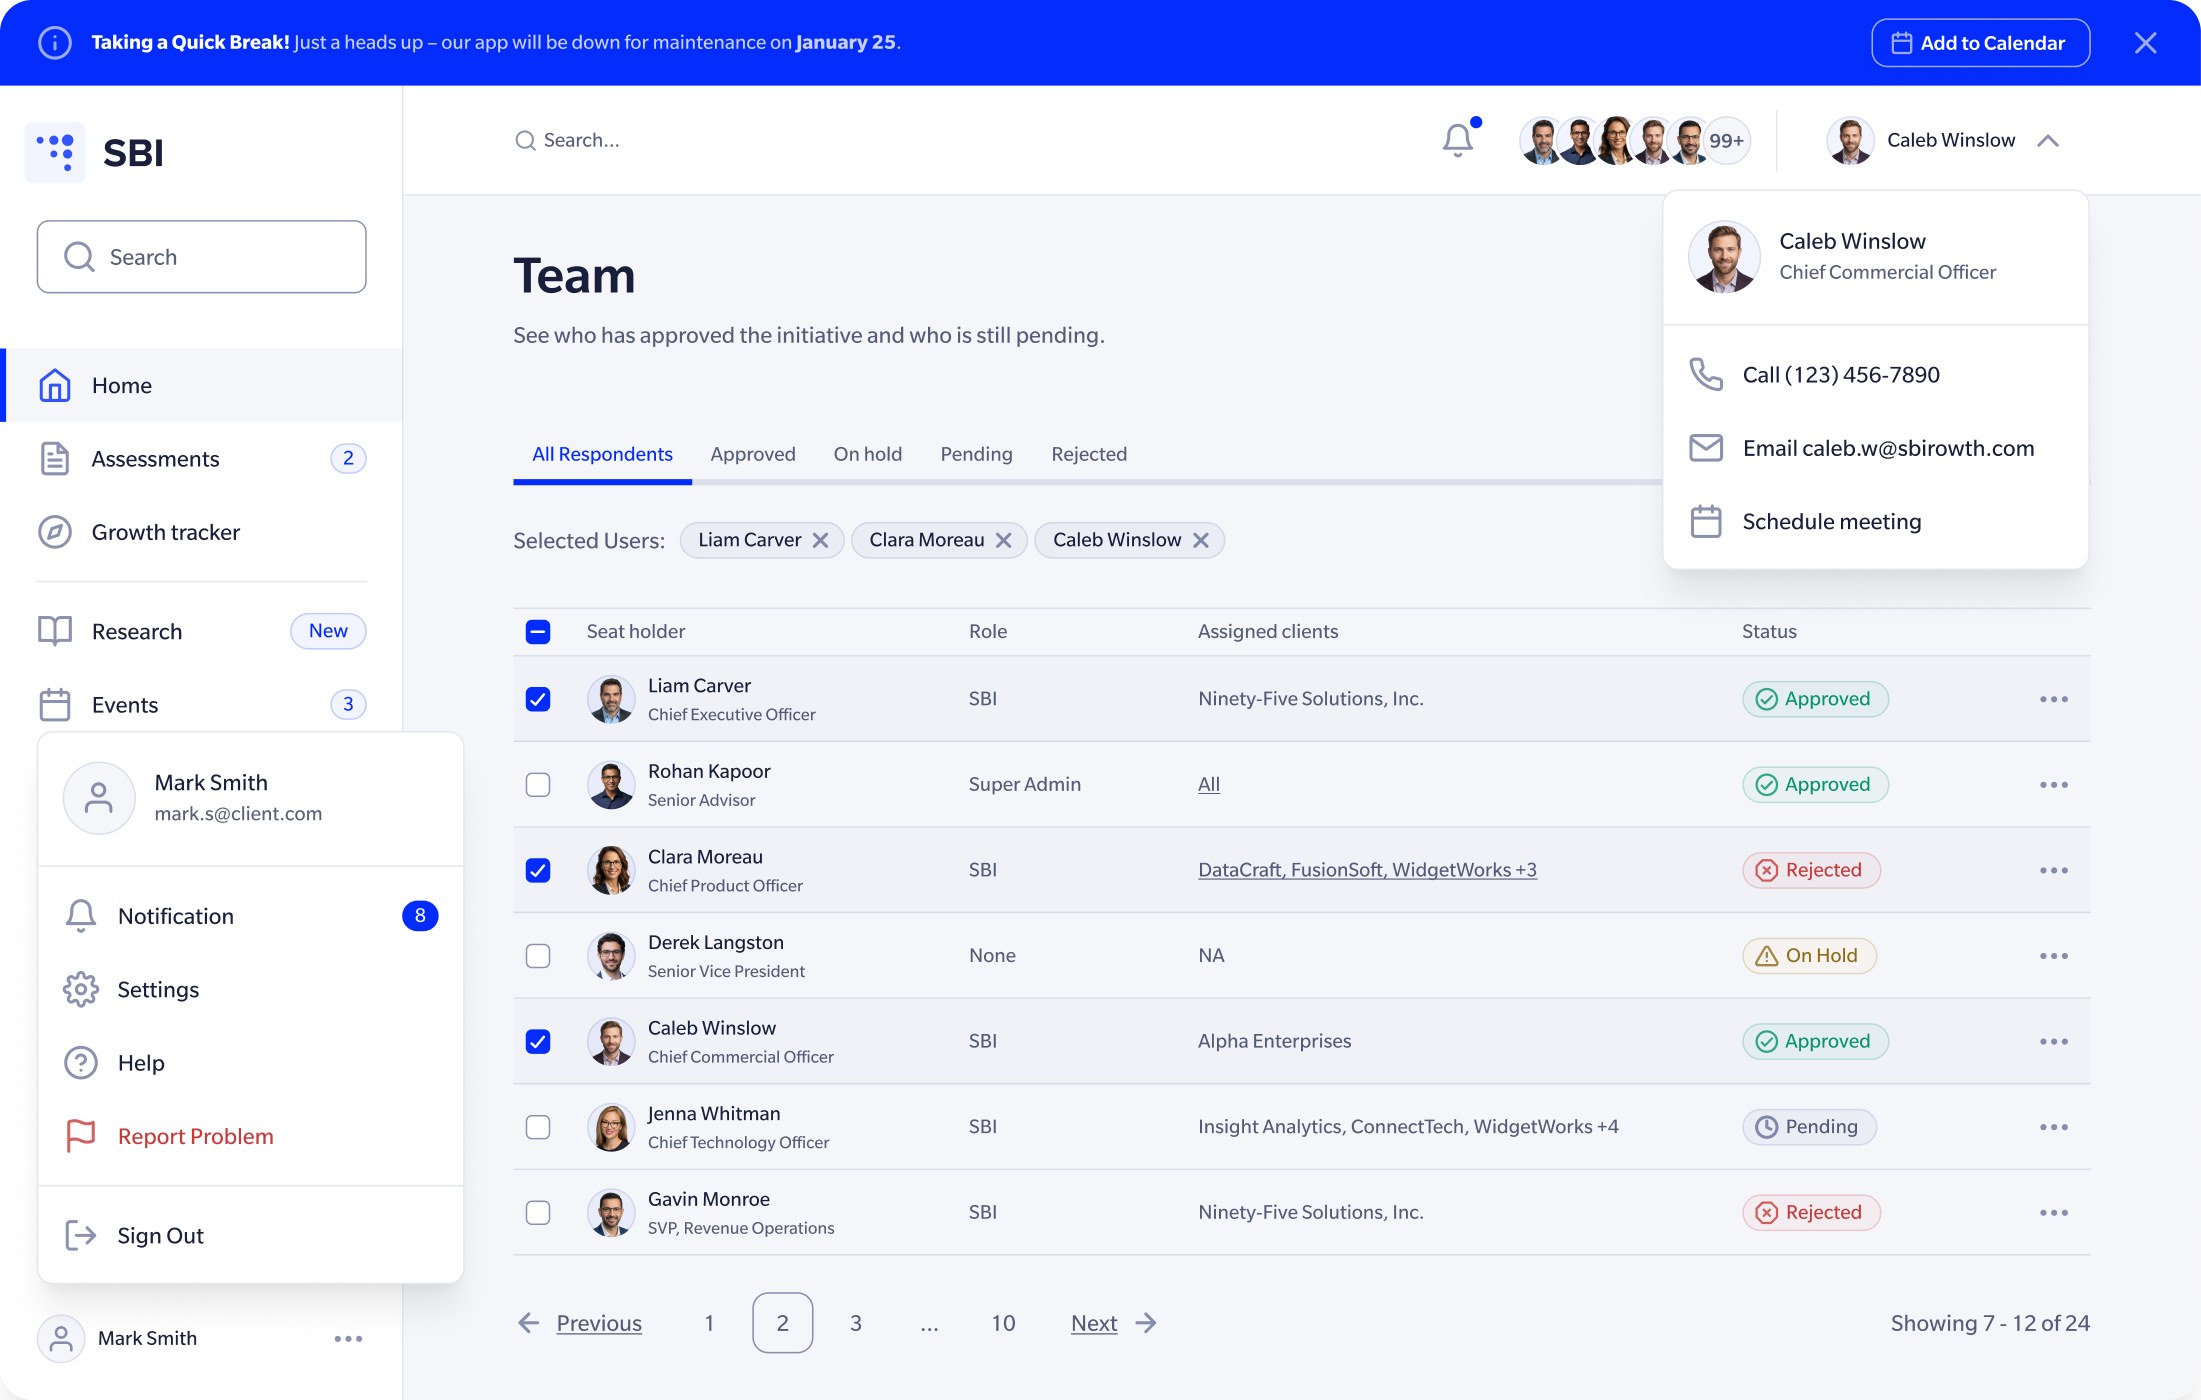 Light
Light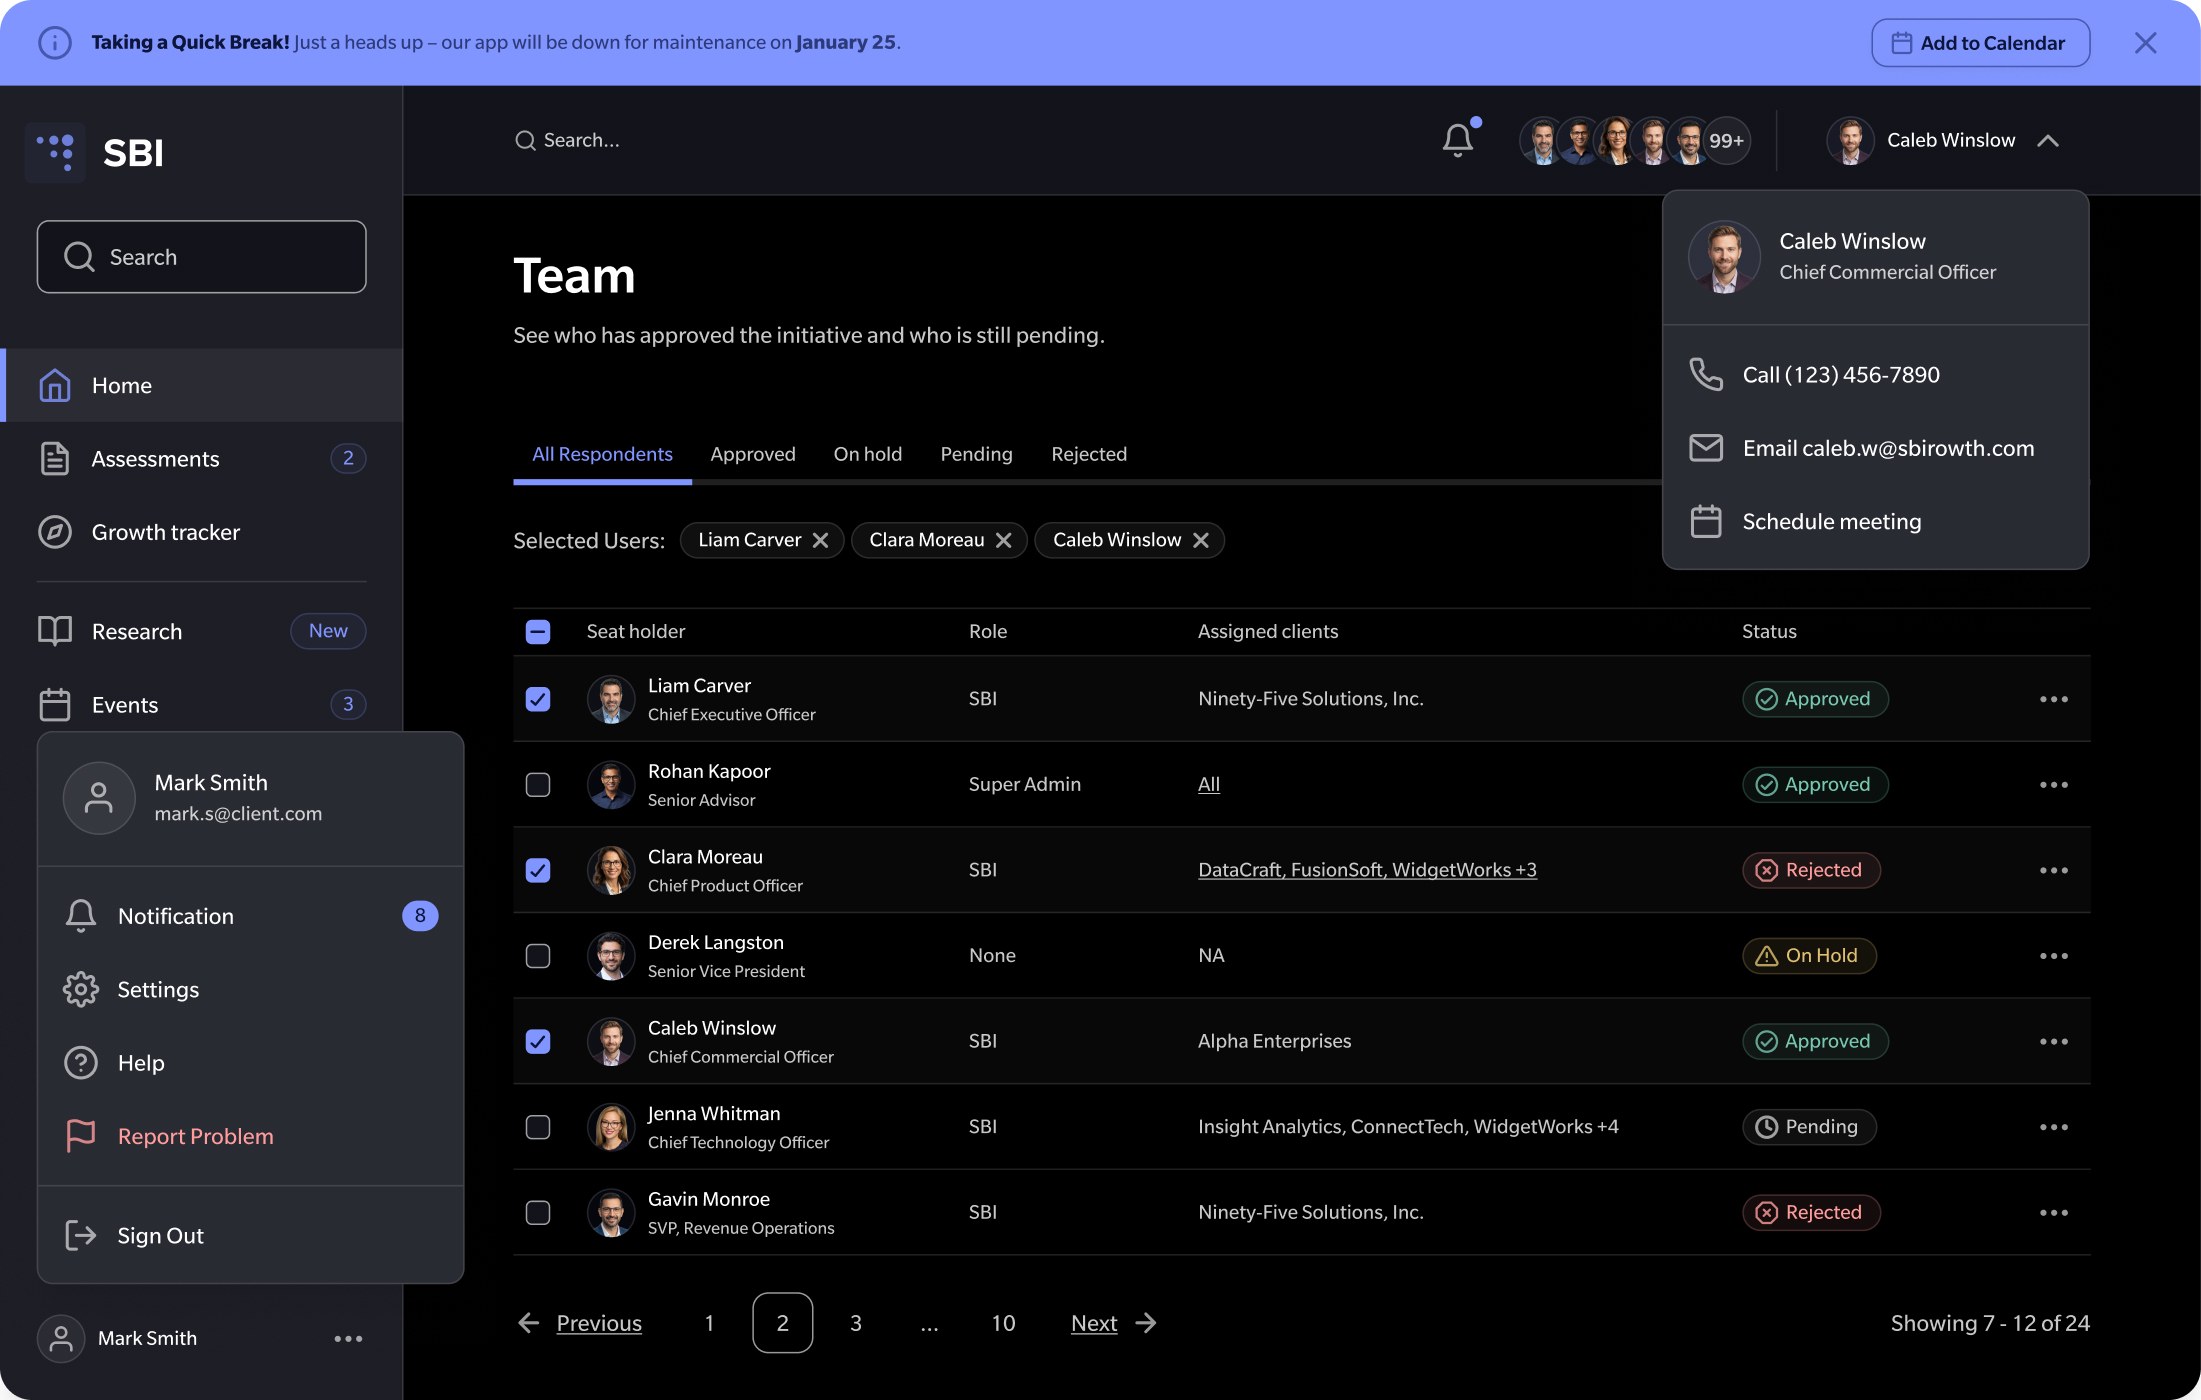 Dark
DarkDrag to compare
Results
3
self-service workflows
1
connected growth roadmap
40
shared components
30%
faster design-to-production delivery
Adoption
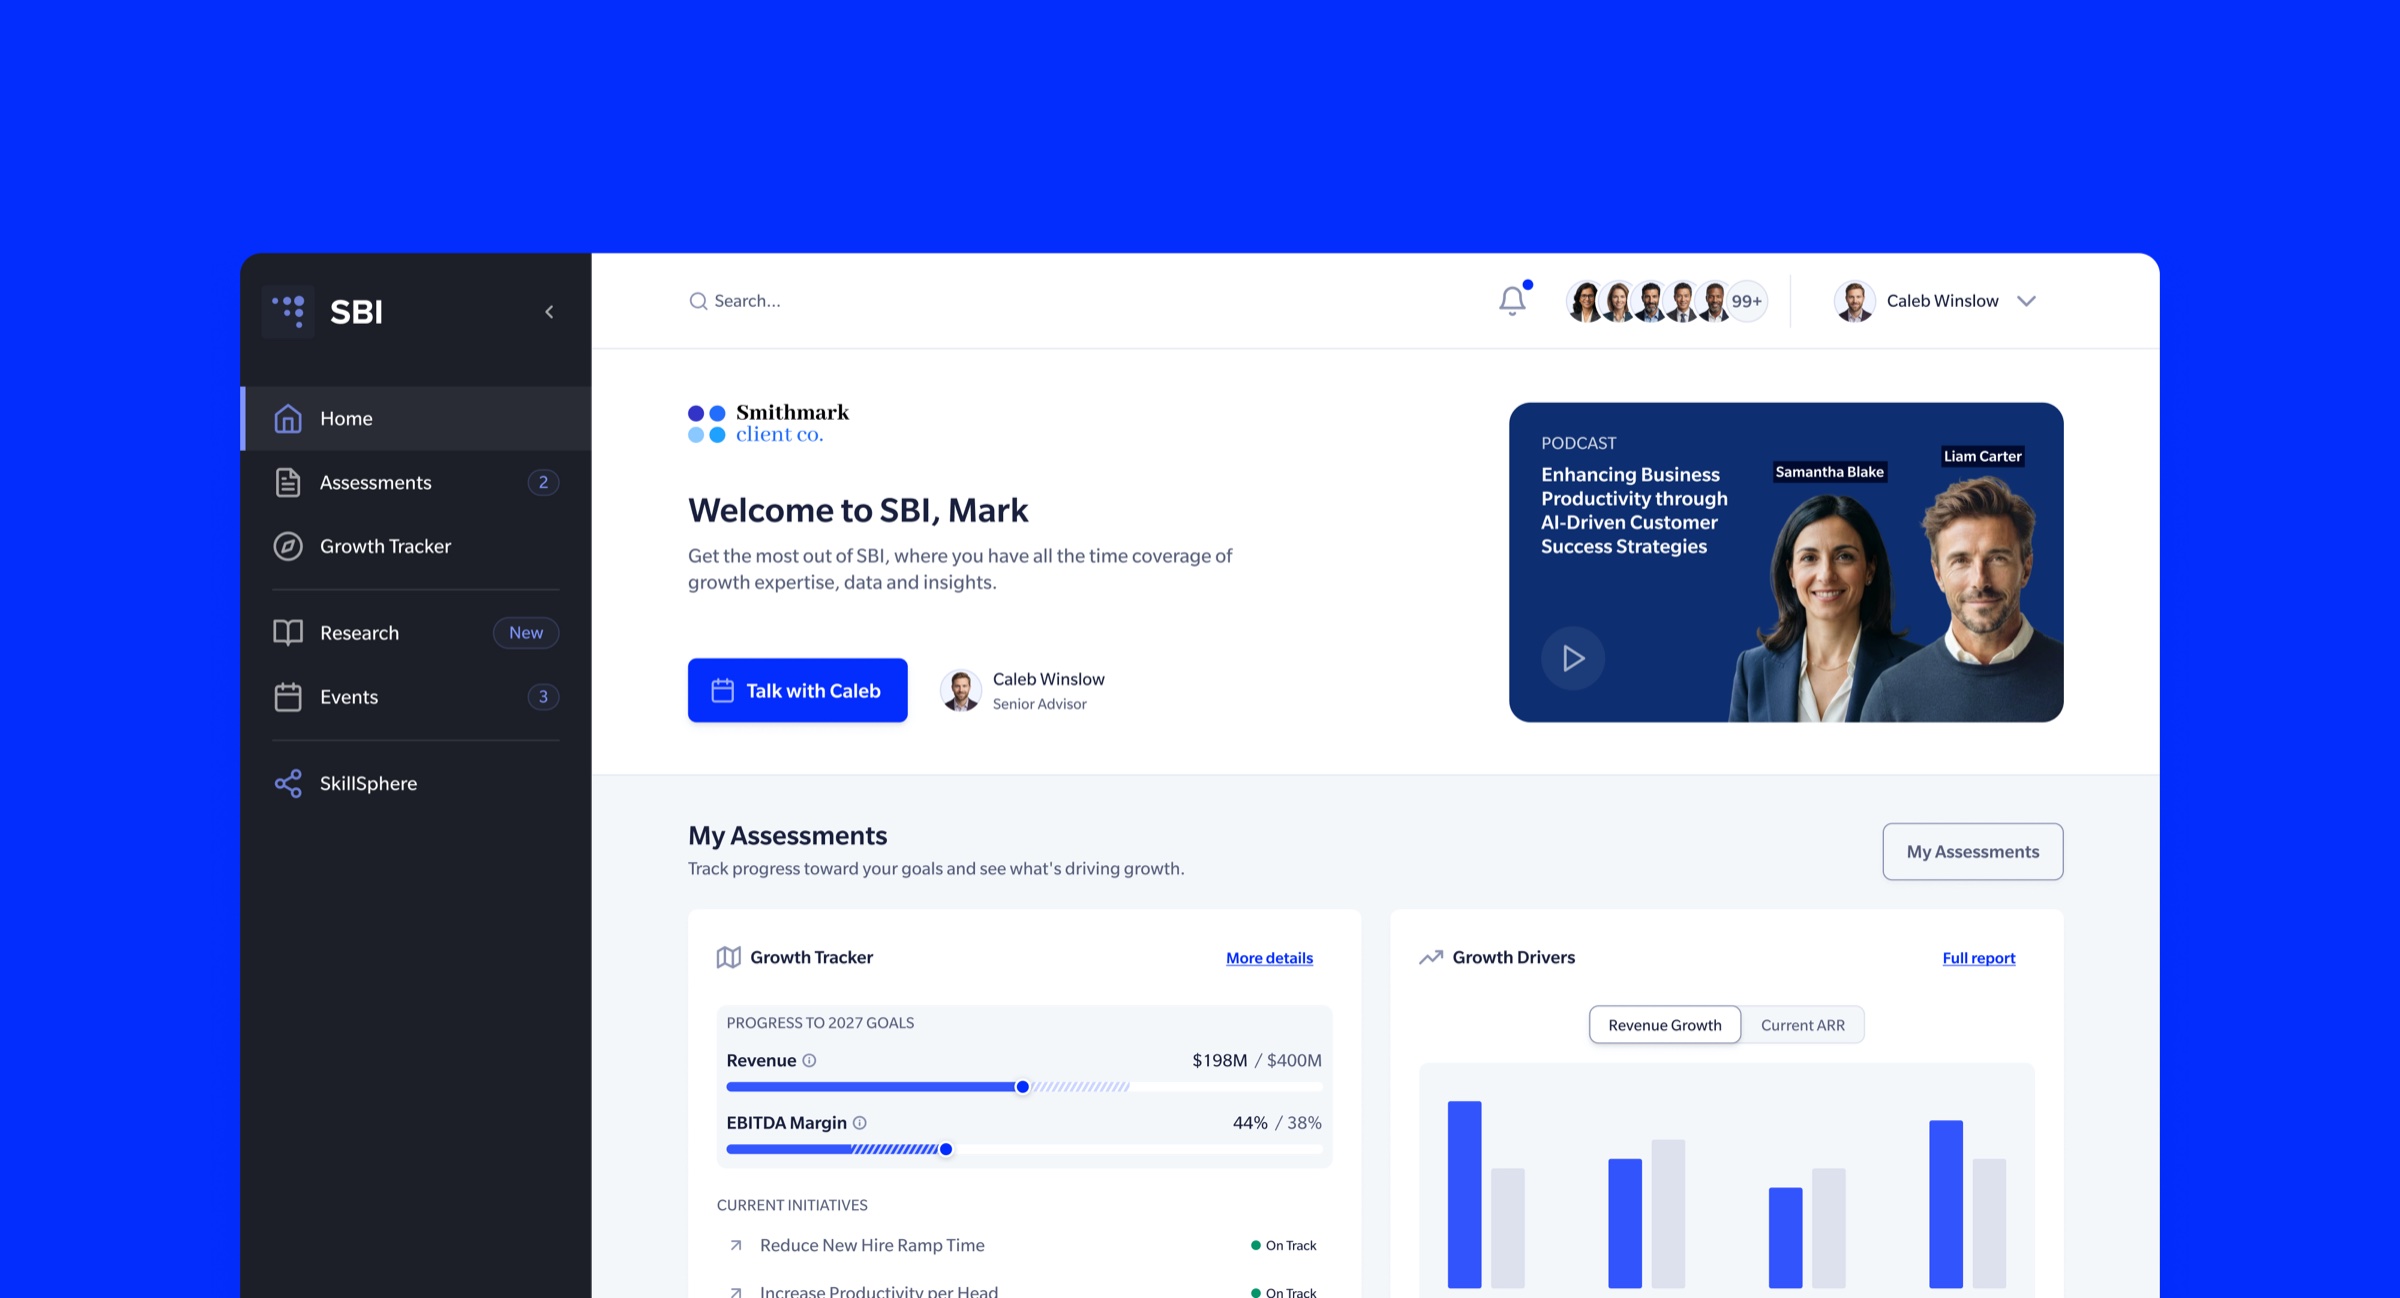
Assessments, roadmap, analysis
Customers could launch assessments, review scores, see their position in the growth plan, and track completed and upcoming work directly in the product, and they returned to monitor progress. Analysts moved repeated assessment setup, reporting, roadmap guidance, and progress tracking into the platform, and stayed involved in interpretation and advisory work.
How the 30% was measured
The team ran two-week sprints and tracked every task in Jira with story points and status. I grouped stories by comparable point ranges, compared median active-to-done time before and after the shared foundation was in regular use, and excluded backend-only work, incidents, and unusually large initiatives. The result was a 30% reduction in design-to-production cycle time for comparable UI work.
A measurement framework for the product
I defined the core funnel from first assessment to ongoing execution: analysis started → recommendation reviewed → roadmap item created → roadmap revisited → progress updated.
| Metric | What it shows |
|---|---|
| Analysis-to-roadmap completion | Completed analyses that became at least one active roadmap initiative |
| 30-day roadmap return | Client teams that returned within 30 days to review or update an active roadmap |
| Self-service completion | Core workflows completed without analyst intervention |
What it changed commercially
- continued use between advisory interactions
- clearer value across assessments, training, reporting, and planning
- more analyst capacity through self-service delivery
Those are the product mechanics a subscription model needs. This case does not attribute a specific revenue increase to design.
Lessons
Building the shared foundation first slowed early delivery. I accepted that, because shipping each workflow on its own would have recreated the fragmentation the product was meant to solve.
I also limited standardization. Some analytical patterns needed different densities or navigation. Forcing them into one component would have hurt usability and pushed teams to bypass the system.
I started out treating the work as a redesign of several tools. Research showed the deeper opportunity was to change what the customer received.
The strongest decision was separating repeatable assembly from expert judgment. Assembly moved into the product; interpretation stayed visible and editable.